


“Come on let’s twist again, Like we did last summer!
Yeaaah, let’s twist again, Like we did last year!”– Chubby Checker
During the last half of 2020, bond yields were flat-lining at historically record low yields. The message was clear: bond investors did not fear inflation. The tone changed abruptly in early January when the ten-year U.S Treasury yield rose above 1.00% in yield. In February, five-year Treasury yields crossed 0.50%, which raised alarms for global investors.
Despite stock market trepidation over rising yields, the Fed remains calm. It appears some Fed members are applauding higher yields. The following four comments came from three Fed members on February 25, 2021, the day in which the five-year Treasury notes gapped higher by 25 bps.
- Jim Bullard: “The rise in bond yields is a good sign so far.”
- Esther George: “Long tern yield rise doesn’t warrant monetary response.”
- Raphael Bostic: “I am not worried about move in yields.”
- Raphael Bostic: “(The Fed) doesn’t need to respond to yields at this point.”
Quite often, Fed members make statements that turn out to be not so true. We believe the comments above fit this bill.
The Fed is keenly aware rising interest rates will choke off the fledgling economic recovery. The possible solution to halting rate increases and keeping the recovery rolling dates back to the 1960s when Chubby Checker and the Twist were all the rage.
In this article, we dissect Operation Twist. We also look back at Operation Twist 2.0 circa 2011/12 and assess its effectiveness and how it impacted various asset classes.
Note: We brought up Operation Twist a month ago in: Can The Fed Both Tap On The Brakes and Floor The Gas? At the time, we thought Operation Twist might alleviate coming irregularities in Treasury issuance.
The Twist 1.0
The Fed introduced Operation Twist 60 years ago (1961) under pressure to spur economic activity. At the time, the dollar was pegged to gold which limited the Fed’s options. Lowering interest rates would have weakened the dollar and led to the withdraw of gold by foreign nations.
To stimulate economic activity and avoid losing gold, the Fed devised Operation Twist. Under the plan, the Fed buys longer-term securities, similar to QE, however, they do not print reserves. Instead, they fund the purchases by selling shorter-term securities. Given the Fed’s balance sheet or money supply wouldn’t change, it was hoped the actions would not weaken the dollar.
Per the San Francisco Fed:
“The Kennedy Administration’s proposed solution to this dilemma was to try to lower longer-term interest rates while keeping short-term interest rates unchanged—an initiative now known as “Operation Twist” in homage to the dance craze then sweeping the nation. The idea was that business investment and housing demand were primarily determined by longer-term interest rates, while cross-currency arbitrage was primarily determined by short-term interest rate differentials across countries. Policymakers reasoned that, if longer-term interest rates could be lowered without affecting short-term yields, the weak U.S. economy could be stimulated without worsening the outflow of gold.“
Let’s Twist Again 2.0
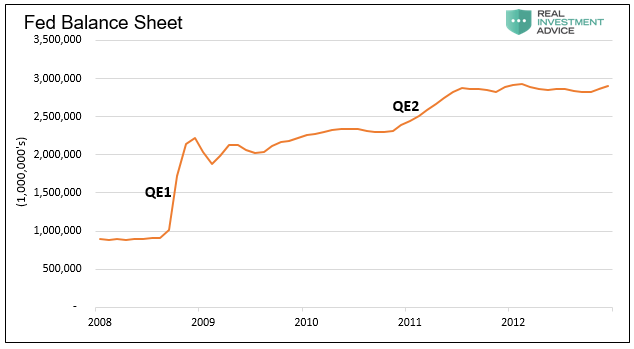
The Fed revisited the Operation Twist playbook in October of 2011. This period was different than 1961 as there was no gold standard and the Fed’s balance sheet was significantly larger. As a result of QE and the financial crisis, the Fed’s balance sheet surged by 200% to nearly $3 trillion from 2008 to when QE2 ended in mid-2011.
The newly held short-term Treasury securities gave the Fed sufficient ability to shift their holdings to longer maturities and encourage economic activity.
The newly held short-term Treasury securities gave the Fed sufficient ability to shift their holdings to longer maturities and encourage economic activity.

Per the Fed: “To support a stronger economic recovery and to help ensure that inflation, over time, is at levels consistent with the dual mandate, the Committee decided today to extend the average maturity of its holdings of securities. The Committee intends to purchase, by the end of June 2012, $400 billion of Treasury securities with remaining maturities of 6 years to 30 years and to sell an equal amount of Treasury securities with remaining maturities of 3 years or less. This program should put downward pressure on longer-term interest rates and help make broader financial conditions more accommodative.”
Why Now?
“I would be concerned if I saw disorderly conditions or persistent tightening in financial conditions that could slow progress toward our goal.” Fed Governor Lael Brainard 3/2/21
In 2011 the Fed stated: “This program (Operation Twist) should put downward pressure on longer-term interest rates and help make broader financial conditions more accommodative.”
The economy’s Achilles heel is higher interest rates and resulting “tightening in financial conditions.” Despite the nonchalance of some Fed members, Lael Brainard understands the problem. She is aware higher rates will all but ensure the economy doesn’t exit from recession.
On May 3, 2021, San Francisco Fed President Mary Daly took Brainard’s comments a step further. She said, “the central bank could alter the maturity of its bond purchases — or even, as it has done before, sell shorter-term securities to buy longer-term government bonds in a so-called “twist.”
As interest rates rise, the odds of Operation Twist 3.0 increase. The Twist can slow or halt rate increases without altering the current $120 billion per month pace of QE. The alternative option, increasing the amount of QE, might cause rates to climb further due to inflationary implications.
Simply, the Twist allows them to manipulate markets without increasing their footprint.
What Twisted and How?
Looking back at Operation Twist 2.0 (2011) we assess how effective their actions were and how various asset classes performed. Such analysis provides some insight into how those asset classes may perform today.
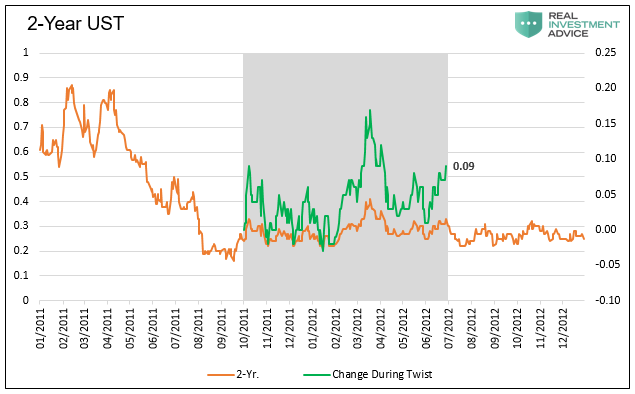
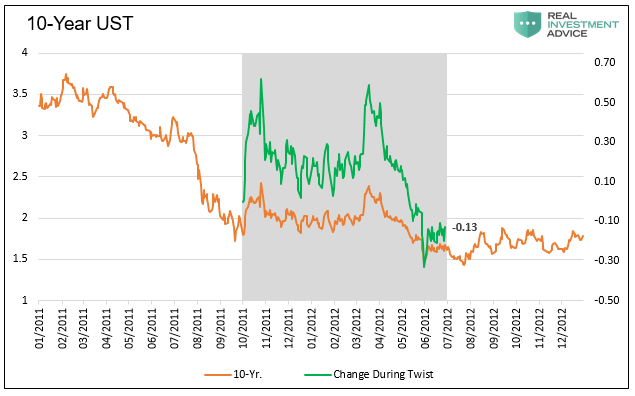
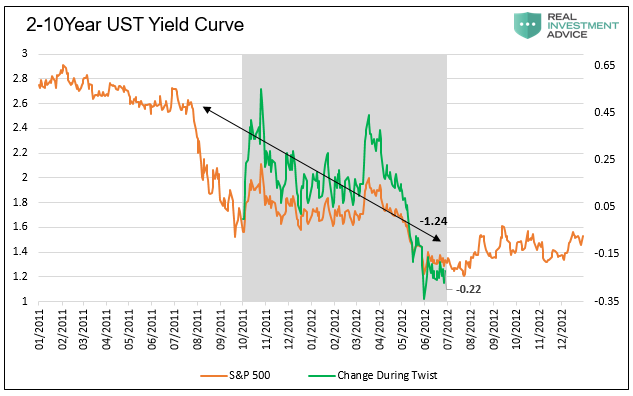
The first three charts below show yields on 2-year and 10-year notes and the 2/10 year yield curve. In the graphs, the period of Operation Twist is highlighted in gray. The green lines show the running percentage change in yields during the Twist operations. Additionally, the 2/10 curve graph highlights the curve flattened by 124 basis points when extending the period from when the Twist was rumored in July 2011 to its completion.
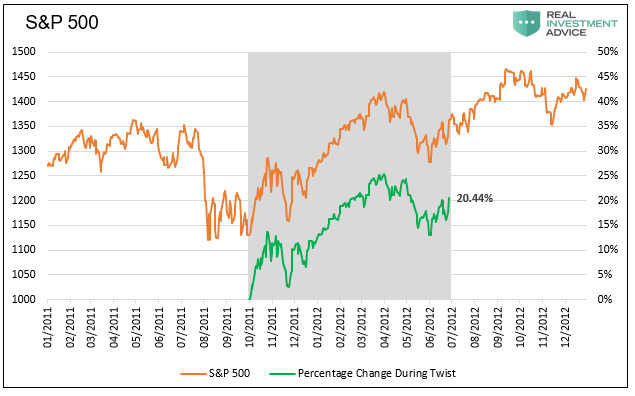
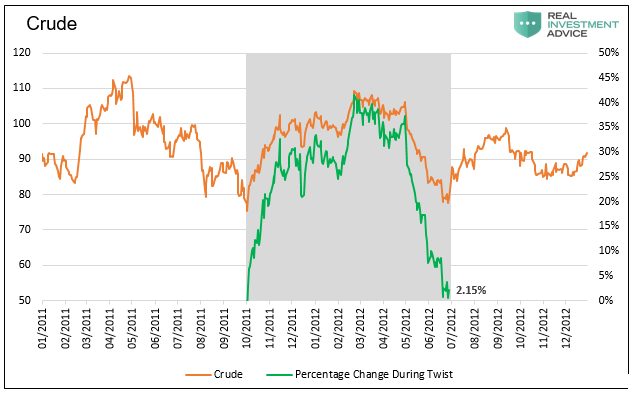
 The next set of graphs use the same format to show how the S&P 500, crude oil, and gold performed during the same period.

 Lastly, we show how the S&P sectors and other equity indexes performed during Operation Twist and the pre-Twist Rumor period.

Operation Twist 2.0 accomplished the Fed’s mission. The yield curve flattened significantly without the Fed increasing its balance sheet. Most of the flattening occurred before actual operations when the Twist was a rumor. Conversely, most equity markets and sectors rose during Operation Twist but were uninspiring during the “rumor” period. It is worth noting, the economy was slowing at the time; therefore macro trends were also contributing to lower rates.
The sectors typically associated with inflation and higher rates, financials, energy, materials, and industrials fell from the point of Twist rumors until its conclusion. Sectors benefiting from lower rates like utilities, technology, and staples did reasonably well throughout the entire period.
Most interesting, the weekly correlation between bond and stock prices from rumor to the end of operations is strongly negative, as shown below.


Summary
“Twistin’ time is heeeere!”
Given the Fed’s bloated balance sheet, it’s just a matter of time before higher yields prompt the Fed to do the Twist. In 2011, when the Fed first hinted about the Twist, the 2/10-year yield curve was 2.60%. Today the yield curve is about half of that level at 1.35%. As such, it is less likely the Twist can have the same effect.
The supply/demand equation for Treasury is debt is also different today. For starters, the Government is running a $3 trillion deficit, about three times that of a decade ago. Offsetting the supply of debt is the Fed’s monthly purchases of $80 billion in Treasury securities. In 2011/12, the Fed’s balance sheet was not growing as QE2 just ended. Further, over the next few months, Treasury issuance will temporarily be light, as we noted in the opening section.
The Fed has enough assets to flatten the yield curve significantly. The question facing investors is how other asset classes will react to such action? Lower rates may placate rising tension in the equity markets. They may also, on the margin, boost economic activity.
Given the extremely speculative nature of markets and massive amounts of fiscal and monetary intervention, we must ask: will investors dance with the Fed, or will they fear something is not right?


Michael Lebowitz, CFA is an Investment Analyst and Portfolio Manager for RIA Advisors. specializing in macroeconomic research, valuations, asset allocation, and risk management. RIA Contributing Editor and Research Director. CFA is an Investment Analyst and Portfolio Manager; Co-founder of 720 Global Research.
Follow Michael on Twitter or go to 720global.com for more research and analysis.
Customer Relationship Summary (Form CRS)
Also Read


