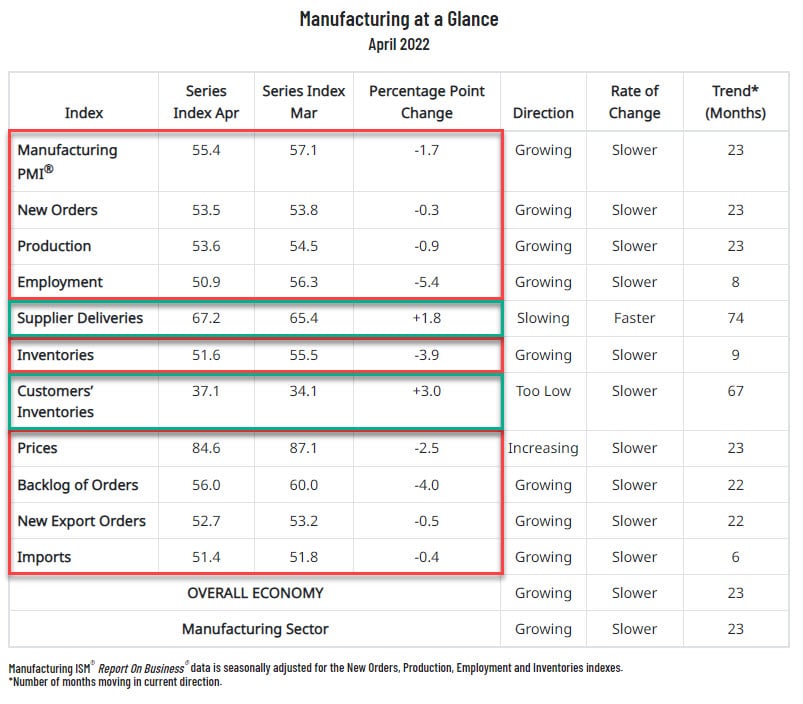
The national ISM Manufacturing Survey was unexpectedly weaker than expected, as shown below. This should be concerning as the ISM survey is often the first piece of data to signal changes in economic activity. As the table shows, the ISM Employment Index fell sharply in April and sits near contractionary economic levels (<50). Equally important, the prices index, while still very high, slowed in April. A weakening ISM is clearly not good news, but battered investors may say otherwise.
The negative GDP report last week, coupled with the ISM survey, may get the Fed to take its hawkish tones down a notch. The market has traded poorly on concerns the Fed will be aggressive with rate increases and QT. It might just be that their hawkish conveyances which pushed stocks down and interest rates higher, may have done a lot of the work for them.

What To Watch Today
Economy
- 10:00 a.m. ET: Factory Orders, March (1.2% expected, -0.5% in February)
- 10:00 a.m. ET: JOLTS Job Openings, March (11.200 million expected, 11.266 million in February)
- 10:00 a.m. ET: Durable Goods Orders, March final (0.8% expected, 0.8% in prior print)
- 10:00 a.m. ET: Durable Goods excluding transportation, March final (1.1% expected, 1.1% in prior print)
- 10:00 a.m. ET: Non-defense Capital Goods Orders, excluding aircraft, March final (1.0% expected, 1.0% in prior print)
- 10:00 a.m. ET: Non-defense Capital Goods Shipments, excluding aircraft, March final (0.2% in prior print)
Earnings
Pre-market
- Hilton Worldwide Holdings (HLT) to report adjusted earnings of 67 cents on revenue of $1.77 billion
- Marathon Petroleum (MPC) to report adjusted earnings of $1.28 on revenue of $34.01 billion
- The Estee Lauder Co. (EL) to report adjusted earnings of $1.67 on revenue of $4.32 billion
- Pfizer (PFE) to report adjusted earnings of $1.55 on revenue of $24.36 billion
- KKR Inc. (KKR) to report adjusted earnings of 98 cents on revenue of $1.73 billion
- Biogen (BIIB) to report adjusted earnings of $4.35 on revenue of $2.50 billion
- Paramount Global (PARA) to report adjusted earnings of 52 cents on revenue of $7.42 billion
- Molson Coors Beverage (TAP) to report adjusted earnings of 19 cents on revenue of $2.13 billion
- S&P Global Inc. (SPGI) to report adjusted earnings of $2.98 on revenue of $2.95 billion
Post-market
- Caesar’s Entertainment (CZR) to report adjusted losses of $2.19 per share of $2.35 billion
- Skyworks Solutions (SWKS) to report adjusted earnings of $2.75 per share of $1.33 billion
- Revolve Group (RVLV) to report adjusted earnings of 26 cents on revenue of $254.05 million
- Airbnb (ABNB) to report adjusted losses of 16 cents on revenue of $1.45 billion
- Starbucks (SBUX) to report adjusted earnings of 60 cents on revenue of $7.62 billion
- Paycom Sofware (PAYC) to report adjusted earnings of $1.75 on revenue of $343.06 million
- Lyft (LYFT) to report adjusted losses of 6 cents on revenue of $844.53 million
- Match Group (MTCH) to report adjusted earnings of 54 cents on revenue of $792.05 million
- Advanced Micro Devices (AMD) to report adjusted earnings of 92 cents on revenue of $5.30 billion
Market Trading Update – Market Holds Support…Barely
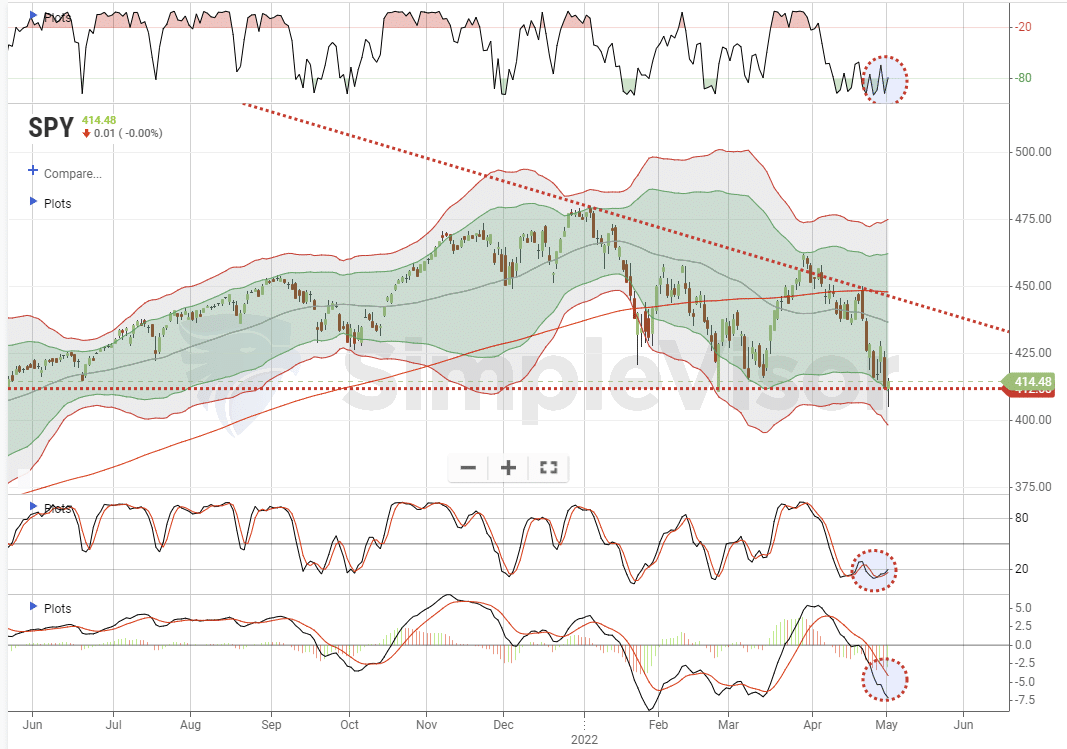
The ISM report, as noted, was a mixed bag showing both signs of inflation peaking and weaker economic growth ahead. As such the market vacillated yesterday but ended in positive territory. Notably, the index did touch the 3-standard deviation oversold level before rebounding into the close. We need to see some follow-through today heading into the FOMC meeting if we are going to muster a short-term oversold rally.
Selling Pressure Hasn’t Been This High In More Than Decade
As noted yesterday by Sentiment Trader, the S&P has closed down 1% or more for 4 consecutive weeks. This type of selling pressure is somewhat rare, with the last instance occurring over a decade ago in 2011.
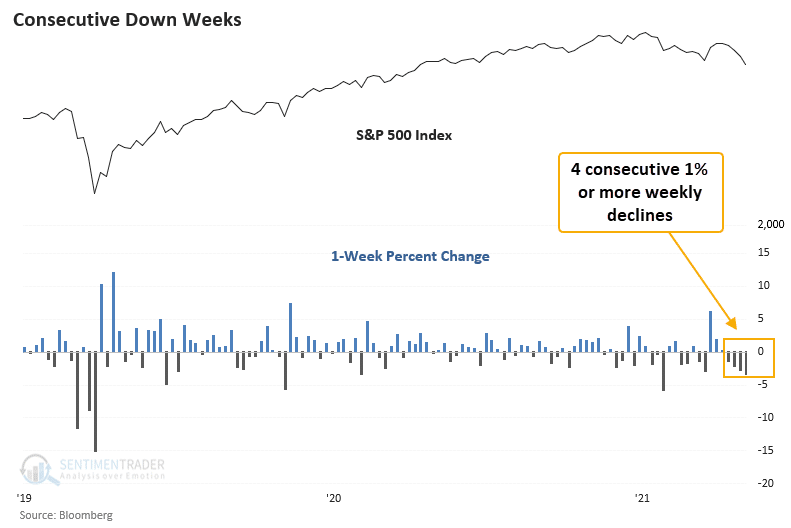
“When the S&P 500 declines by 1% or more for 4 consecutive weeks, the selling pressure continues in the near term. If I isolated instances when the index was down 15% or less from a multi-year high as today, the study shows weak results in the near term. However, the long-term outlook is constructive, with an 89% win rate 1 year later.” – Sentiment Trader
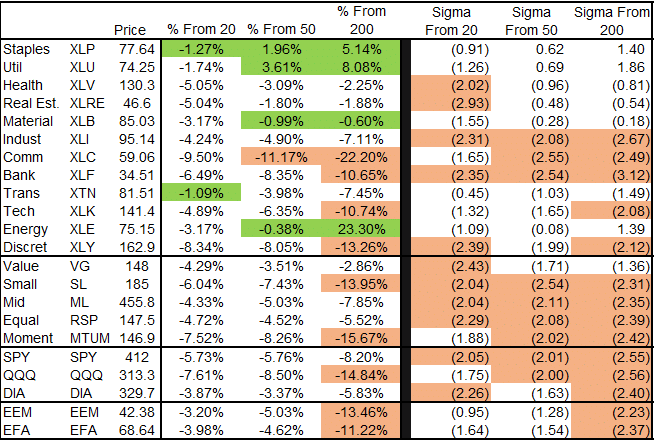
Is a Bounce Overdue?
The table below shows five of the twelve S&P 500 sectors are more than two standard deviations below their 200dma. Further down, you will see all three major indexes and most style factors are in the same camp. Such an oversold situation often results in a bounce. Might the Fed meeting on Wednesday be that catalyst that helps stocks?
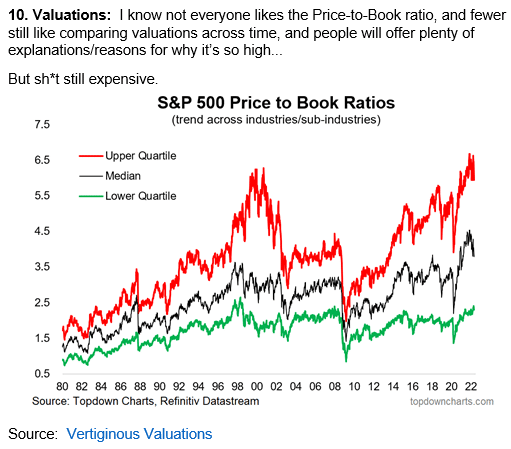
Valuations Ain’t Cheap
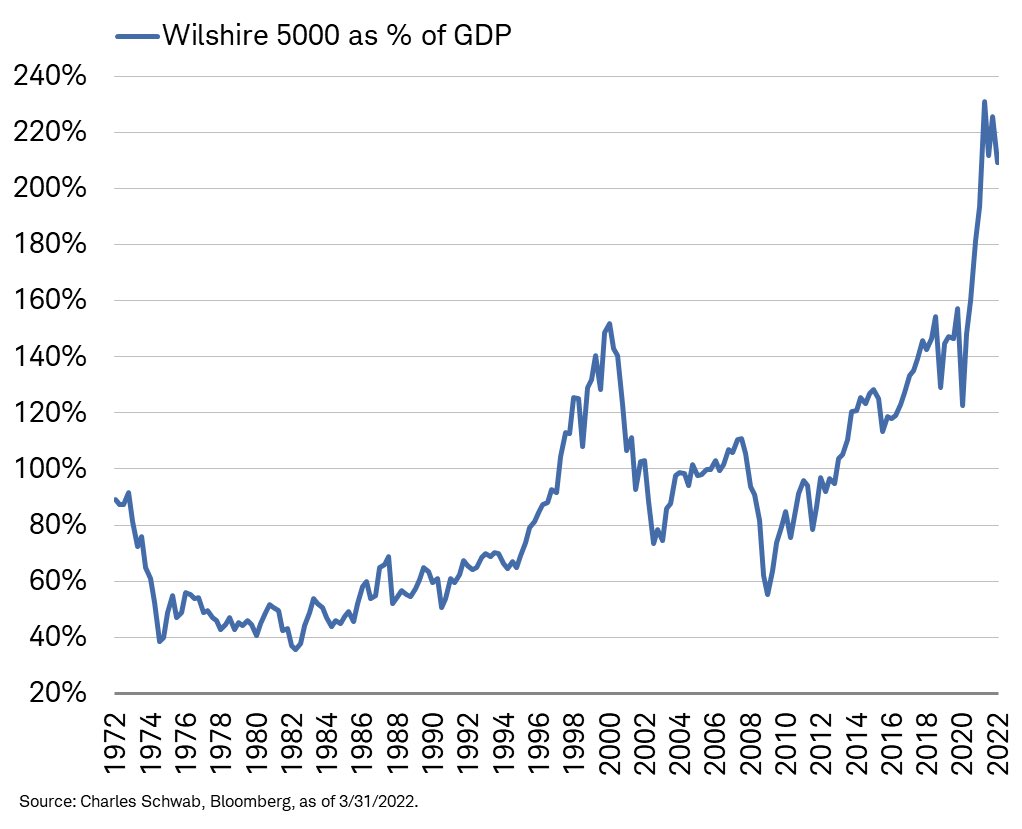
The short missive and graph below from Callum Thomas warn that despite the recent declines in prices, valuations are far from cheap. To quote Callum: “But sh*t still expensive.” The second graph shows it’s not only the S&P 500 large mega-cap stocks that are expensive. Warren Buffet’s favorite valuation indicator shows the market cap of the all-inclusive Wilshire index of 5000 stocks compared to GDP is well above any prior peak.
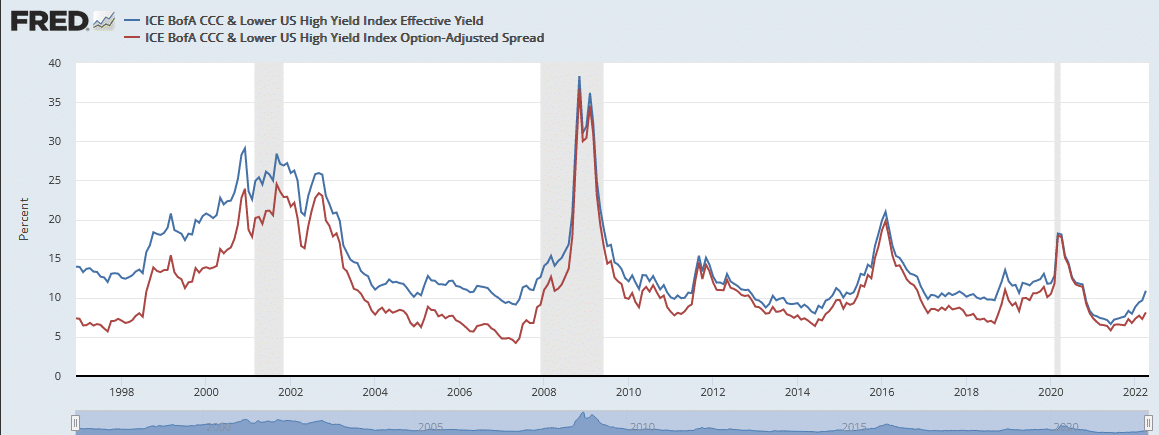
Junk Debt Yields Surge
We have read a few articles stating that the recent increase in corporate bond yields, specifically junk bond yields, is a warning that financial market liquidity is tightening. Yes, yields tend to rise rapidly when liquidity becomes scarce, especially in riskier markets. But, the recent yield increase is not abnormal, nor are yields particularly high. The graph shows that CCC-junk-rated corporate debt is approaching 11% (blue), nearing the ten-year average. It has been up about 4.5% since early 2021, but Treasury yields have also risen significantly.
The spread or difference in yield between CCC bonds and Treasuries has only risen by about 1.5% over the period. In periods of financial stress, you will note that both yields and spreads rose significantly more than we are witnessing today. This might be the start of a much bigger jump in yields, but for now, it does not signify systematic financial stress.
Recession Warnings Focus on the Consumer
Last week the BEA announced GDP fell 1.4%. While it was a quarterly economic contraction, an NBER-defined recession does not occur unless there are two negative quarters in a row. Might that happen in July? To help answer the question, the two graphs below are essential. Before viewing them, let’s consider two important facts about the way GDP is calculated. First, personal consumption, or money spent by individuals, counts for roughly two-thirds of GDP. Ergo, the means and sentiment of consumers are possibly the two most important factors driving GDP. Second, investors and economists tend to focus on GDP after price inflation. This is called real GDP.
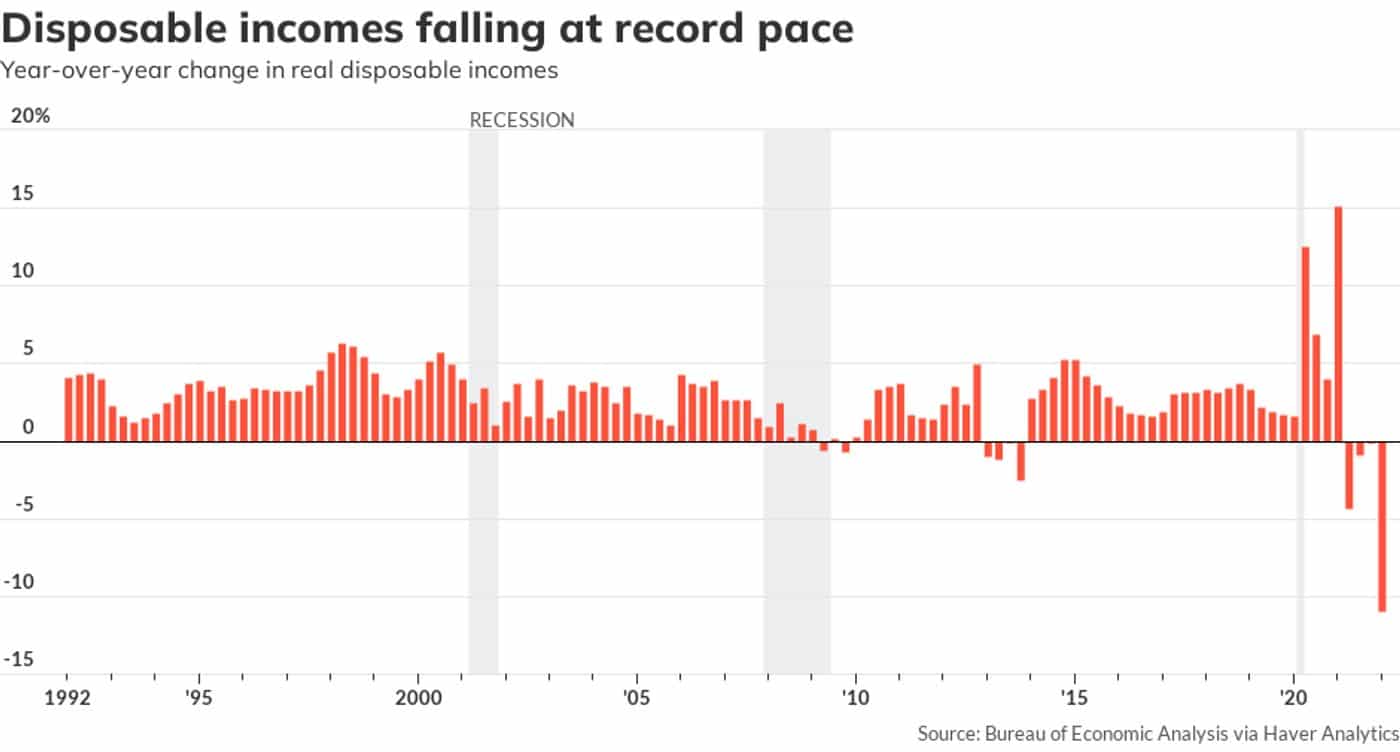
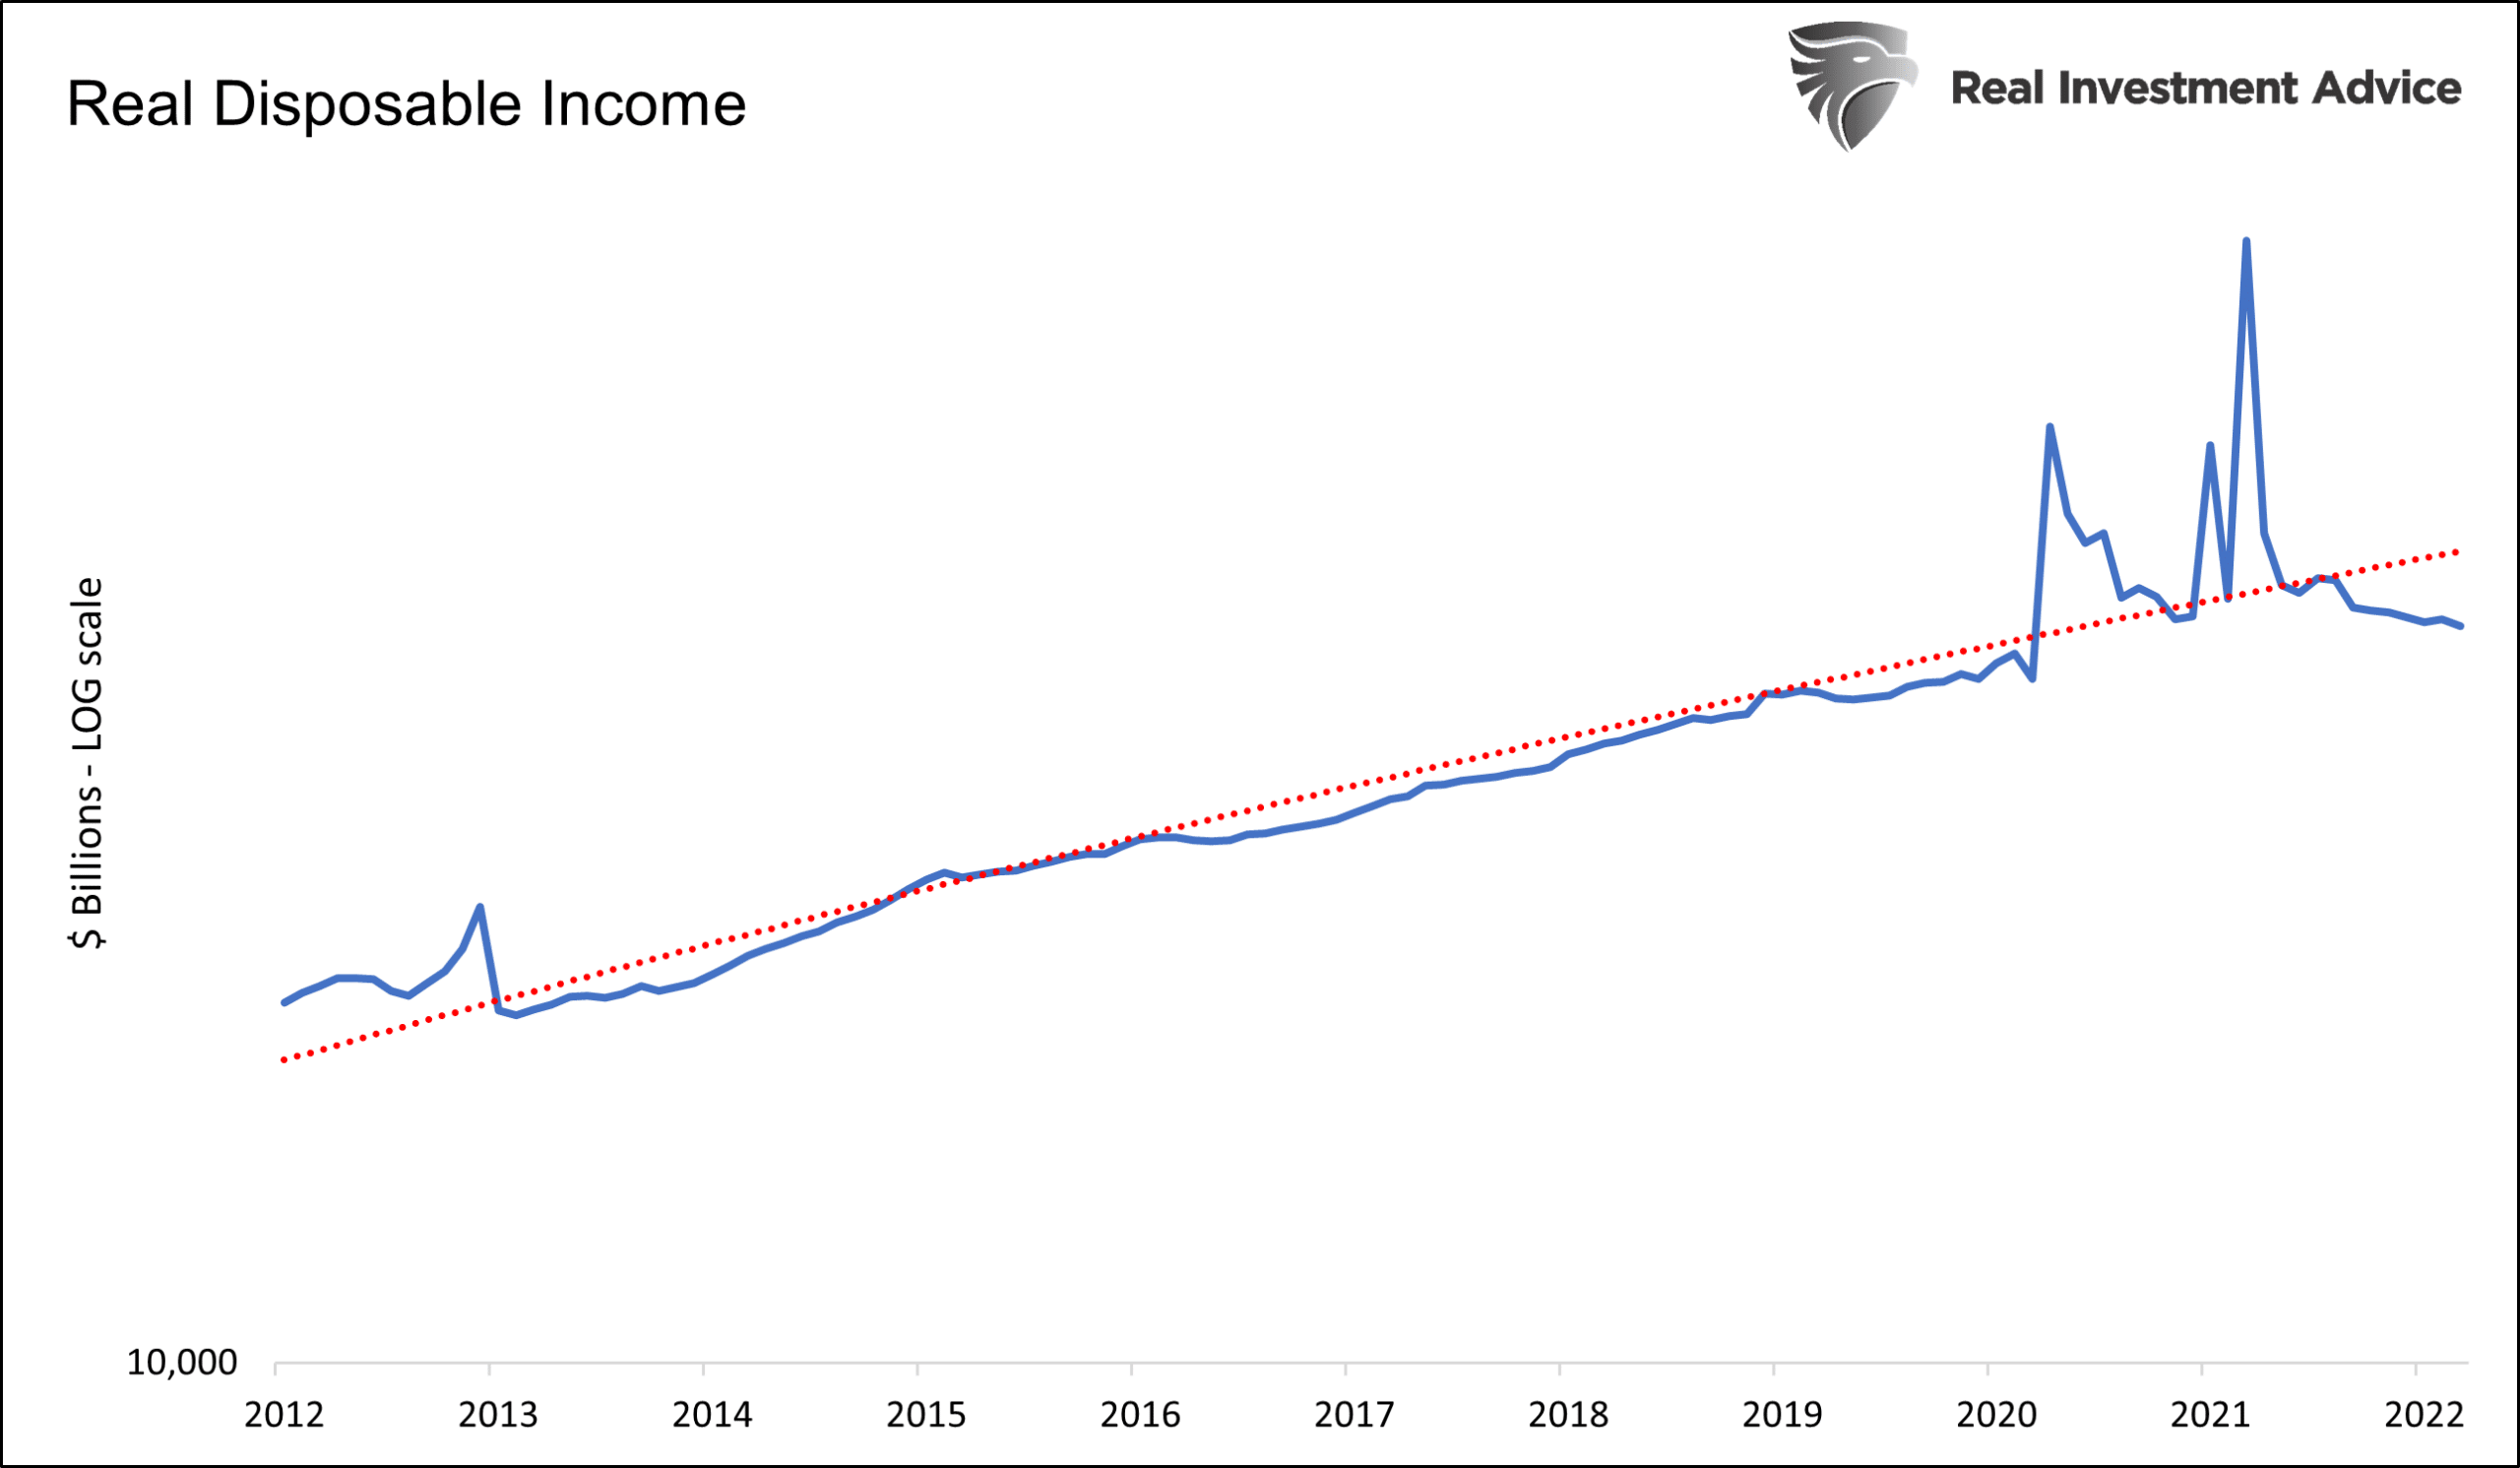
The graphs below show real consumers’ disposable incomes are falling below trend. The first graph shows the year-over-year change in real disposable incomes fell over 10% in the latest report. The second graph puts the data on a logarithmic scale to compare the actual data to the post-financial crisis trend. Again it shows real income was well above the trend in 2020 and 2021. That was wholly attributable to government stimulus. Conversely, incomes slipped below trend on a more organic basis when the stimulus was gone. Nominal wages are rising but not as quickly as inflation. It appears to us that real incomes will not get back to trend unless more stimulus is doled out or inflation sharply reverses below the rate of wage growth (5%).
If inflation continues to rise quicker than wages, and ISM continues to contract, the likelihood of a recession will increase.
Please subscribe to the daily commentary to receive these updates every morning before the opening bell.
If you found this blog useful, please send it to someone else, share it on social media, or contact us to set up a meeting.
Also Read