


In this issue of, “Is It Insanely Stupid To Chase Stocks As The Economy Plunges.”
- Stocks Hug The Bullish Trend
- The Gold/Dollar Conundrum
- The GDP Crash
- Is It “Insanely Stupid” To Chase Stocks
- Managing Into The Unknown
- MacroView: Universal Basic Income Is Not An Economic Savior
- Sector & Market Analysis
- 401k Plan Manager
Follow Us On: Twitter, Facebook, Linked-In, Sound Cloud, Seeking Alpha
WEBINAR: Retirement Right Lane Workshop
Register today for our most popular class covering everything you need to know about retirement, Medicare, Medicaid, Social Security, Roth conversions, RMD’s, investing, markets, and more.
WHEN: Saturday, August 8th, 9-11 am

Catch Up On What You Missed Last Week

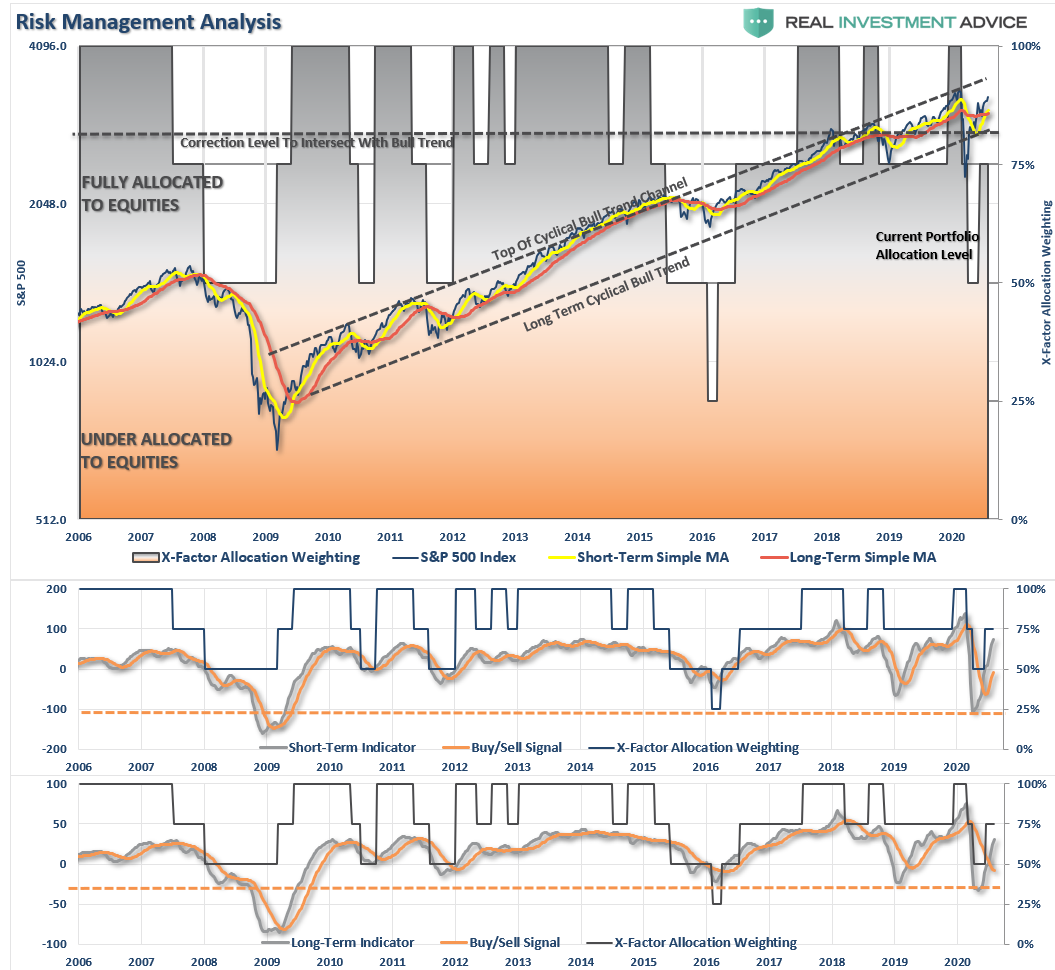
Stocks Hug The Bullish Trend
As discussed previously in “The Cobra Effect,” we noted the market remained confined to its consolidation channel.
“Unfortunately, the market failed to hold its breakout, which keeps it within the defined trading range. The market did hold its rising bullish uptrend support trend line, which keeps the “bullish bias” to the market intact for now. “
That remained the case again this week and keeps our allocation models primarily on hold at the moment.

While the market has not been able to push above the recent July highs., support is holding at the rising bullish trend line. With the short-term “buy signals” back in play, the bias at the moment is to the upside. However, as we have discussed over the last couple of weeks, July held to its historical trends of strength. With a bulk of the S&P 500 earnings season behind us, we suspect the weakening economic data will begin to weigh on sentiment in August and September.
Such is why we are keeping our hedges in place for now.
The Gold / Dollar Battle
Speaking of hedges, we began to accumulate a long-dollar position in portfolios this past week. There are several reasons for this:
- When the financial media discusses the dollar’s demise, such is usually a good contrarian signal.
- The dollar has recently had a negative correlation to stocks, bonds, gold, commodities, etc.
- The surging exuberance in gold also acts as a reliable contrarian indicator of the dollar.
- The dollar is currently 3-standard deviations below the 200-dma, which historically is a strong buy signal for a counter-trend rally.
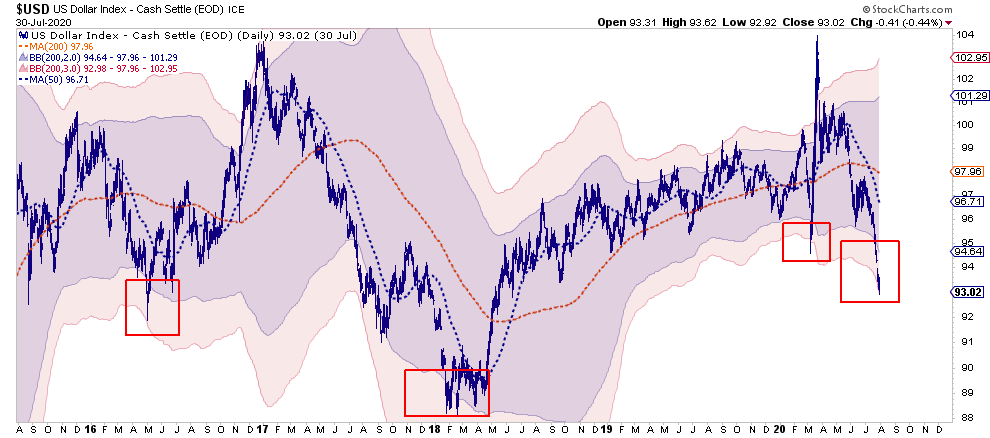
Given our portfolios are long weighted in equities, bonds, and gold currently, we need to start hedging that risk with a non-correlated asset. We also trimmed some of our holdings in conjunction with adding a dollar hedge.
Our friends at Sentiment Trader also picked up on the same idea and published the following charts supporting our thesis. As shown, hedge fund exposure to the dollar has reached more bearish extremes.
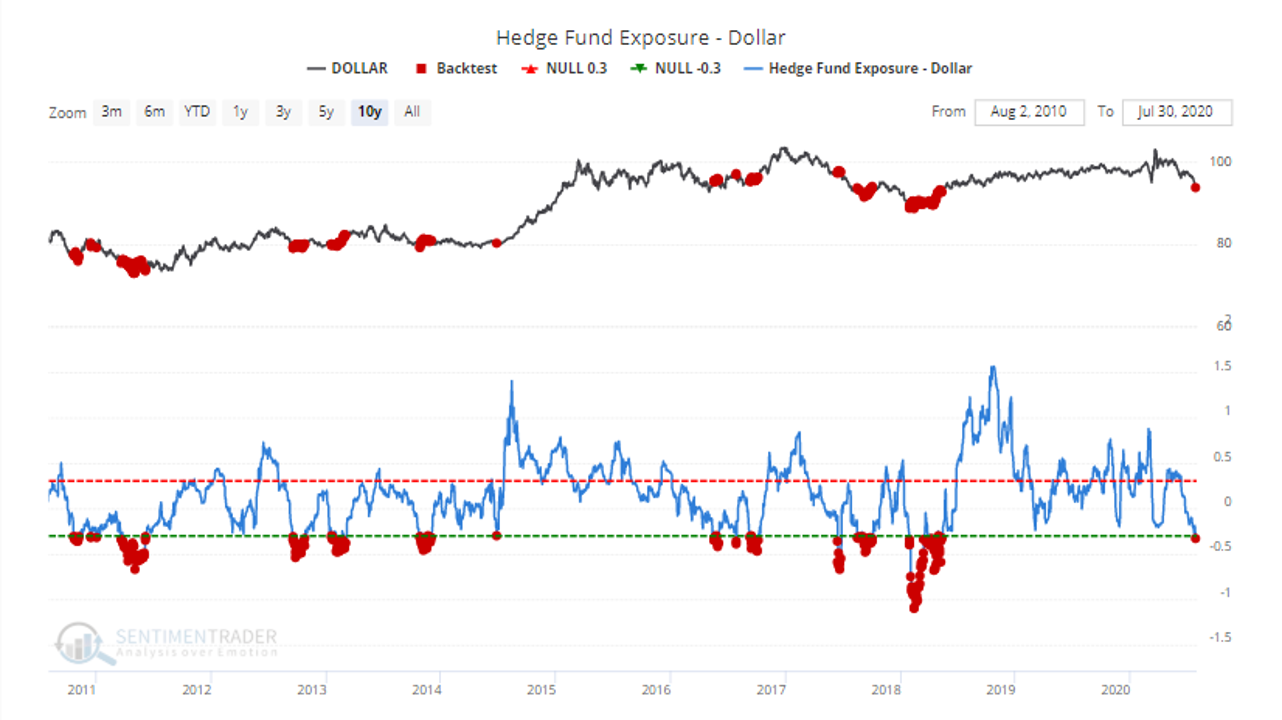
As noted previously, the dollar has a non-corollary relationship to gold. Whenever there is extreme negative positioning in the dollar, forward returns are negative across every time frame.
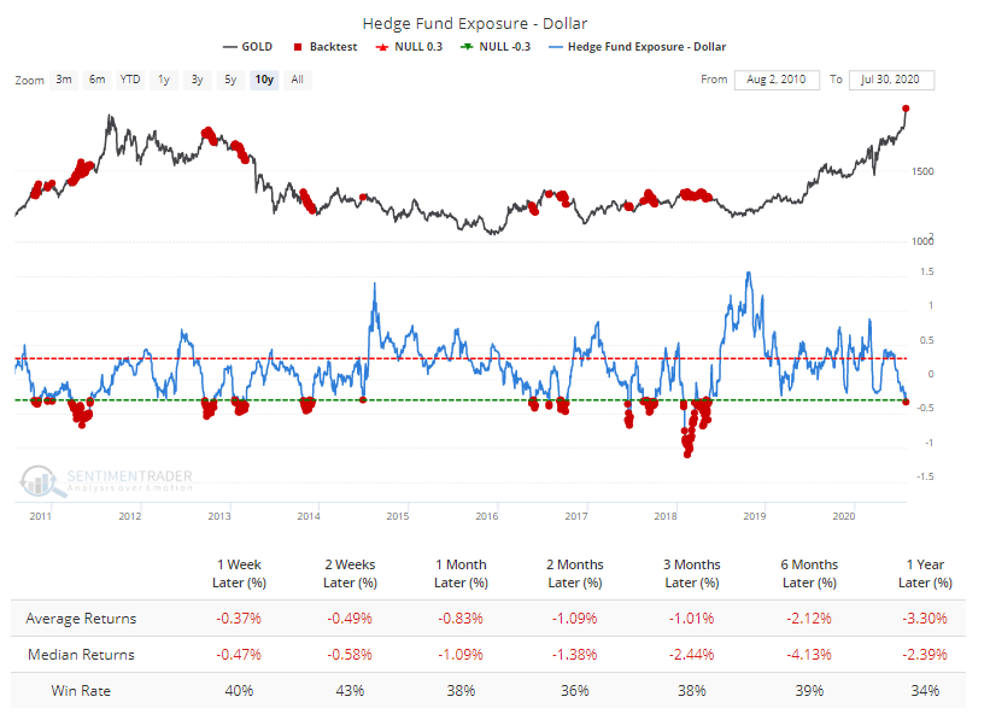
The vital thing to note here is that opportunity generally exists as points of extremes. When stocks, gold, and bonds are stretched beyond normal bounds (200-dma), reversions tend to occur. The only question is timing.
However, with that said, the disconnect between the economy and the market remains a conundrum.

The GDP Crash
On Friday, we got the first official estimate of GDP for the second quarter. It many ways it was just as bad as we had feared. As shown in the chart below, the print of a nearly 38%, inflation-adjusted decline was stunning.
However, the “return to economic normality” faces immense challenges. High rates of unemployment, suppressed wages, and elevated debt levels, make a “V-shaped” recovery unlikely. Nonetheless, the current estimates for Q3 forward suggest record-setting rates of GDP growth.

Such is where the “math” becomes problematic. A 38% drawdown in Q2, requires about a 67% recovery to return to even. In the more optimistic recovery scenario detailed above, three-quarters of record recovery rates still leave the economy running in a deep recession.
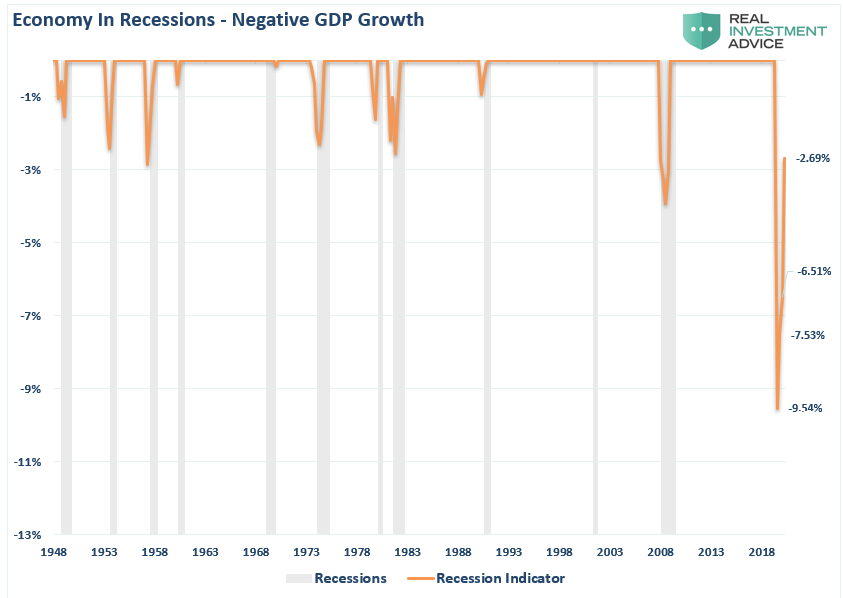
Even if the economy achieves high recovery rates, it won’t change the recession. The resulting 2.7% economic deficit will remain one of the deepest in history. While we would welcome such a recovery, it is not enough to support more substantial employment, wage growth, or corporate earnings.
A Whole New (Lower) Trend
Here is the issue missed by the majority of mainstream economists.
Before the “Financial Crisis,” the economy had a linear growth trend of real GDP of 3.2%. Following the 2008 recession, the growth rate dropped to the exponential growth trend of roughly 2.2%. Instead of reducing the debt problems, unproductive debt, and leverage increased.
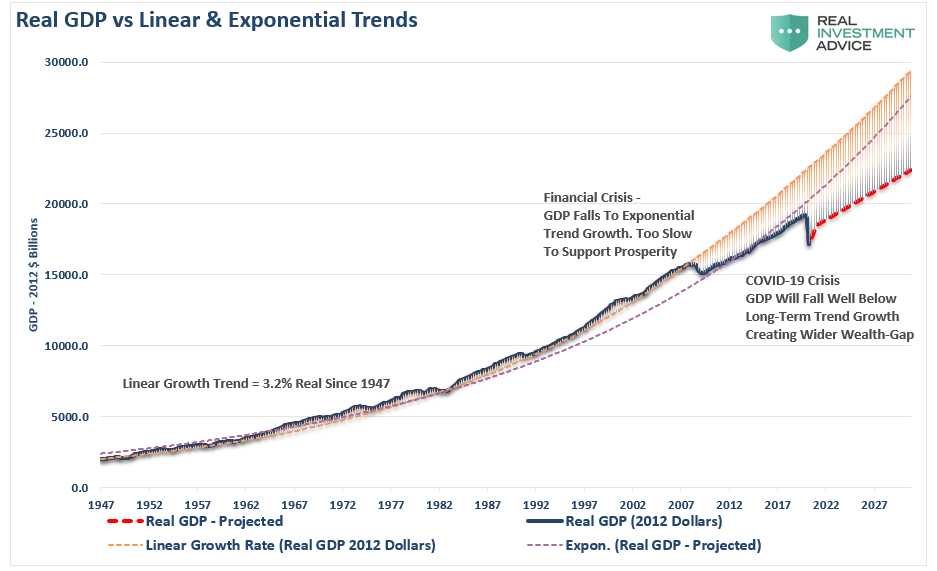
The “COVID-19” crisis led to a debt surge to new highs. Such will result in a retardation of economic growth to 1.5% or less. As discussed previously, while the stock market may rise due to massive Fed liquidity, only the top-10% of the population owning 88% of the market will benefit. Going forward, the economic bifurcation will deepen to the point where 5% of the population owns virtually all of it.
“That is not economic prosperity. It is a distortion of economics.”
All Hat, No Cattle
Importantly, these are all extremely optimistic assumptions based on massive interventions by the Federal Government. While the economic plunge was terrible, had it not been for the massive infusions of Government stimulus, it would have been far worse.
The chart below shows the annual percentage change in Federal expenditures and the rate of GDP growth less Fed expenditures. Essentially, there was ZERO economic growth, ex-federal expenditures.
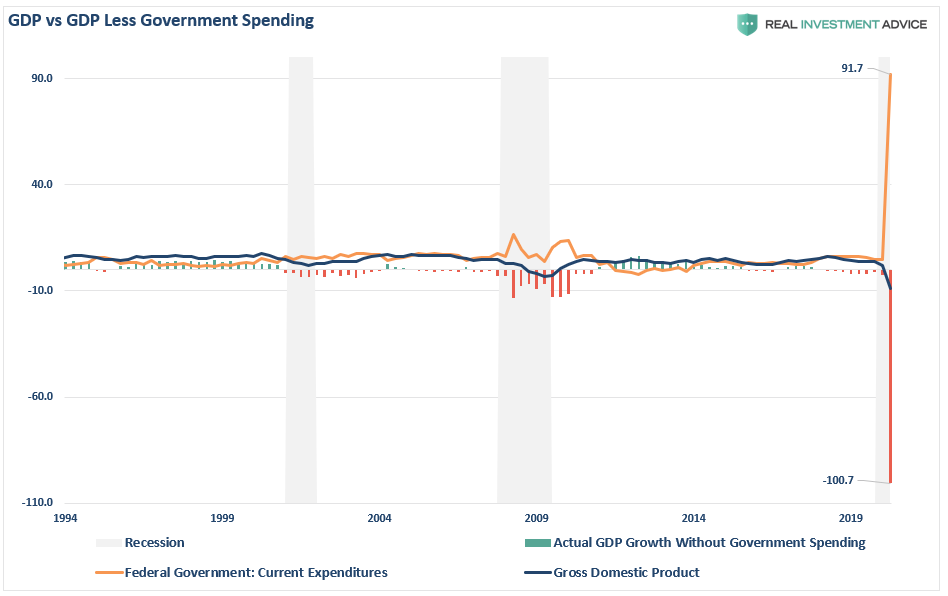
However, that is also why the stock market has done so well.
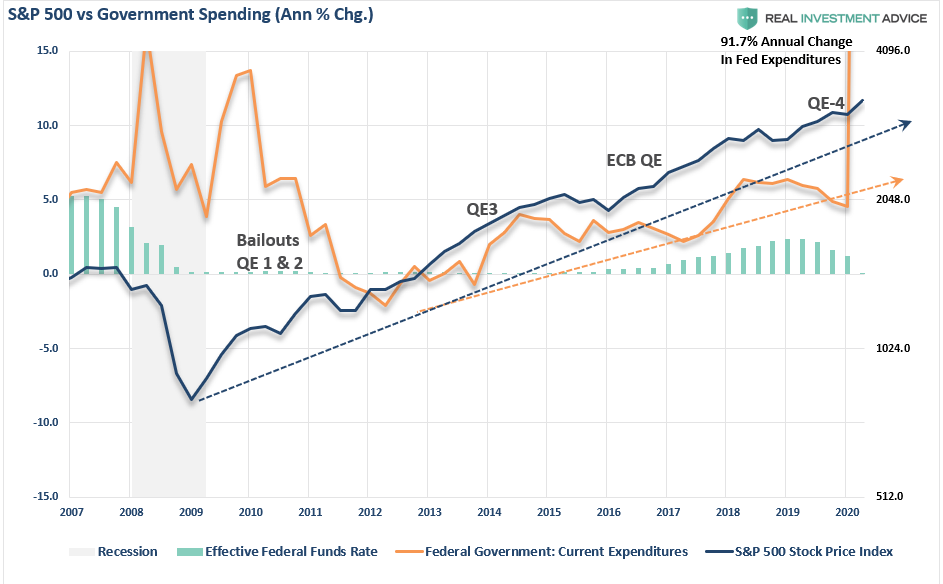
The problem is the Government’s ability to continue spending at increasing rates to support economic growth and the markets.
As they say in Texas, the current rally has been “all hat and no cattle.”
Such is the most significant risk for the bulls.

Insanely Stupid
This past week, we discussed with our RIAPro Subscribers (Try Risk-Free for 30-days) the dangers of chasing markets, which have deviated extremely from their long-term means. The risk, of course, is that markets always, without exception, revert to the mean. The only question is the “timing” of the event.
Such was a point recently discussed by Sarah Ponczek and Michael Regan at Advisor Perspectives:
“People buying bubble assets will make money until they don’t. If they don’t have a view of what it will take for me to say, ‘OK, enough already, I’m going to get out,’ then they are doomed to ride the roller coaster over the top and down. So without a sell discipline, buying bubble assets is insanely stupid.” – Rob Arnott, Research Affiliates
As we have discussed in this missive previously, you can’t have a stock market that remains detached from fundamentals indefinitely.
Reversions Happen Fast
Importantly, throughout history, it is not fundamentals that catch up with the market, but the opposite. The only question is, what causes that reversion?
Unfortunately, we don’t, and won’t, know what the catalyst will eventually be. It won’t be COVID, bad economic data, or even weak earnings. All those issues have been factored into the market and “rationalized” by investors using earnings 3-years into the future.
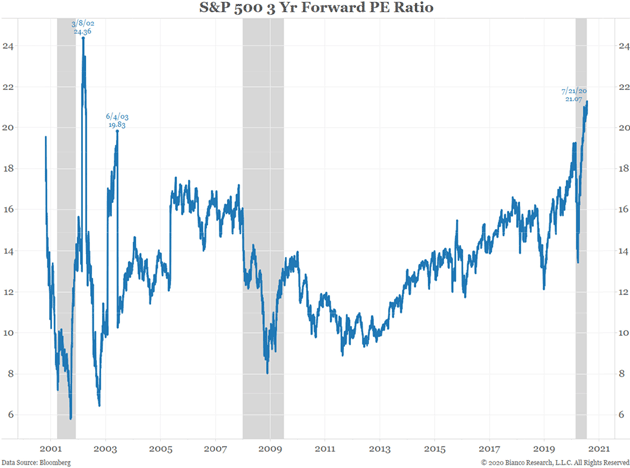
While that is also insanely stupid, investors will get away with it until some exogenous, unexpected event catches the market off-guard. When it happens, like it did in March, it will take investors by surprise and the damage will be just as consequential.
There are a tremendous number of things that can go wrong in the months ahead. Such is particularly the case of surging stocks against a depressionary economy. While investors cling to the “hope” that the Fed has everything under control, there is more than a small chance they don’t.
Regardless, there is one truth about stocks and the economy.
“Stocks are NOT the economy. But the economy is a reflection of the very thing that supports higher asset prices – corporate profits.”
Such is why we continue to manage risk, adjust exposures, and hedge accordingly.
Is it “insanely stupid” to chase stocks here? Probably. But as Keynes once quipped, “the markets can remain irrational longer than you can remain solvent.”
We understand the risk we are taking in this market, and we have a risk management discipline we follow. Or rather, as Rob Arnott suggests, a rigorous “sell discipline.”
Will it absolve us of any downside risk in portfolios?
Absolutely not.
But it will definitely reduce the risk to our capital more than not having one at all.

Managing Into The Unknown
As discussed above, we are heading into seasonally two of the weakest market months of the year. Such comes at a time when Congress is battling over the next relief bill, the Federal Reserve is slowing weekly bond buying, and the economic recovery is faltering. There is also the risk of a Presidential election that goes completely awry.
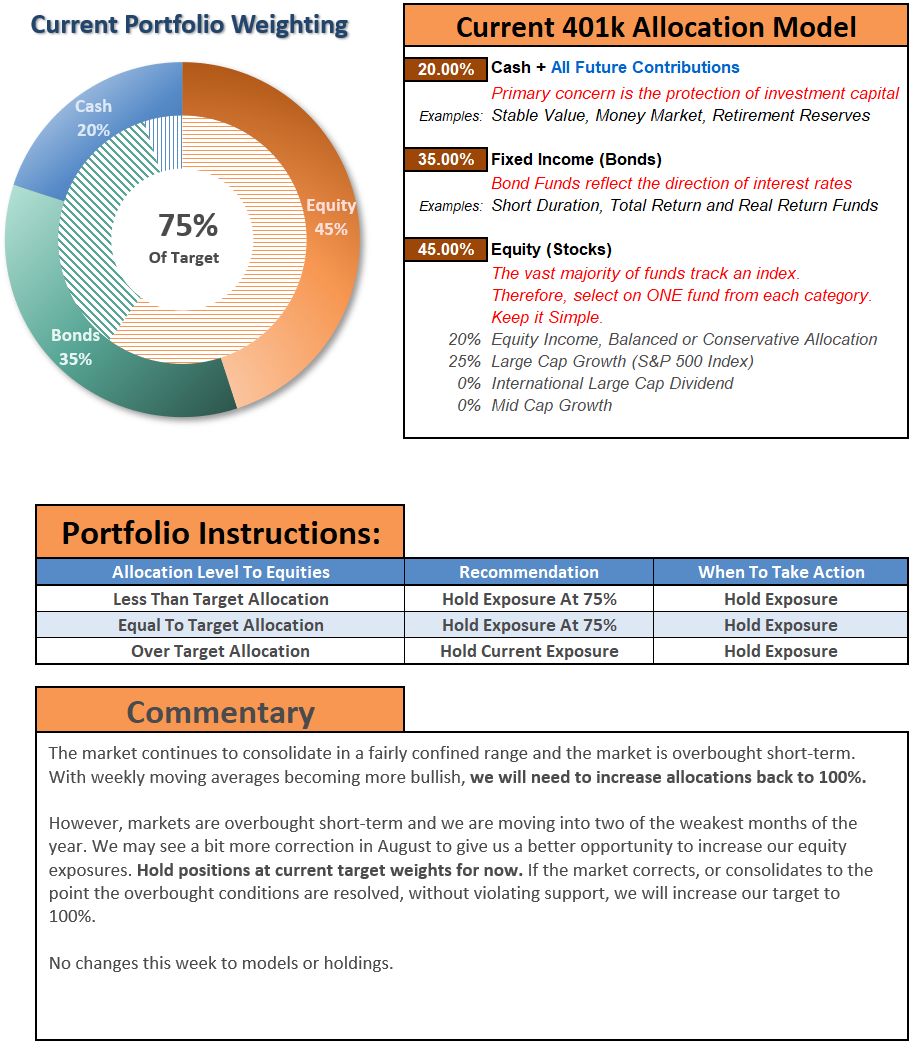
With the market currently extended, overbought, and overly bullish, we suggest the following actions to manage portfolios over the next couple of months.
- Re-evaluate overall portfolio exposures. We will look to initially reduce overall equity allocations.
- Use rallies to raise cash as needed. (Cash is a risk-free portfolio hedge)
- Review all positions (Sell losers/trim winners)
- Look for opportunities in other markets (The dollar is extremely oversold.)
- Add hedges to portfolios.
- Trade opportunistically (There are always rotations which can be taken advantage of)
- Drastically tighten up stop losses. (We had previously given stop losses a bit of leeway due to deeply oversold conditions in March. Such is no longer the case.)
The Risk Of Ignoring Risk
There remains an ongoing bullish bias that continues to support the market near-term. Bull markets built on “momentum” are very hard to kill. Warning signs can last longer than logic would predict. The risk comes when investors begin to “discount” the warnings and assume they are wrong.
It is usually just about then the inevitable correction occurs. Such is the inherent risk of ignoring risk.
In reality, there is little to lose by paying attention to “risk.”
If the warning signs do prove incorrect, it is a simple process to remove hedges and reallocate back to equity risk accordingly.
However, if these warning signs do come to fruition, then a more conservative stance in portfolios will protect capital in the short-term. A reduction in volatility allows for a logical approach to making further adjustments as the correction becomes more apparent. (The goal is not to get forced into a “panic selling” situation.)
It also allows you the opportunity to follow the “Golden Investment Rule:”
“Buy low and sell high.”
So, now you know why we are looking for a “sellable rally.”

The MacroView
If you need help or have questions, we are always glad to help. Just email me.
See You Next Week
By Lance Roberts, CIO
Market & Sector Analysis
Data Analysis Of The Market & Sectors For Traders
S&P 500 Tear Sheet

Performance Analysis

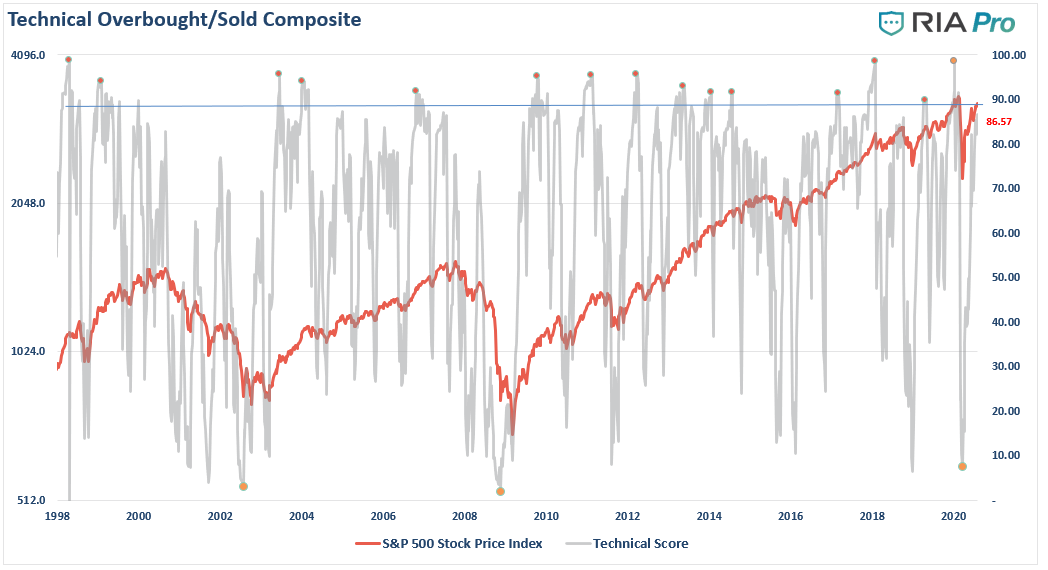
Technical Composite
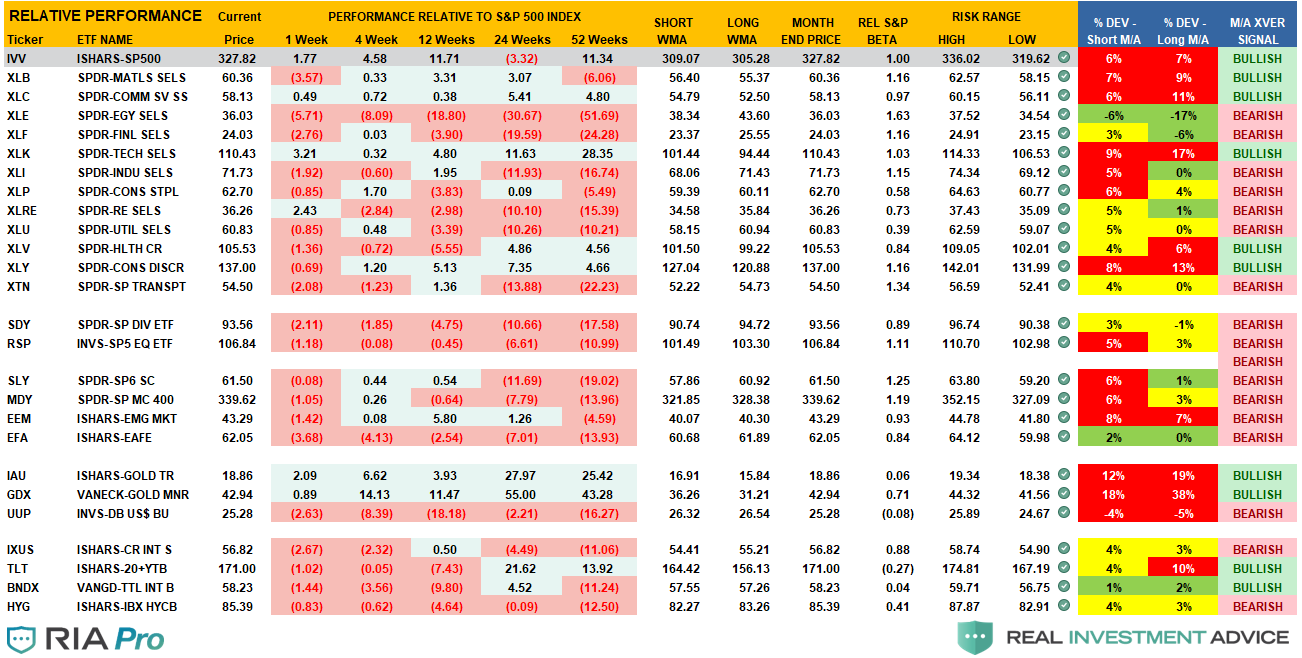
Sector Model Analysis & Risk Ranges
How To Read.
- The table compares each sector and market to the S&P 500 index on relative performance.
- The “MA XVER” is determined by whether the short-term weekly moving average crosses positively or negatively with the long-term weekly moving average.
- The risk range is a function of the month-end closing price and the “beta” of the sector or market.
- The table shows the price deviation above and below the weekly moving averages.
Sector & Market Analysis:
Be sure and catch our updates on Major Markets (Monday) and Major Sectors (Tuesday) with updated buy/stop/sell levels.
Sector-by-Sector

Improving – Financials (XLF), Industrials (XLI), and Energy (XLE)
Previously we noted that Financials moved into the improving quadrant of the rotation model. Still, performance continues to be poor but has improved relative to the S&P 500 this past week. There is some value in the sector, but we are still avoiding banks for now. The same goes for Energy performance, which remains inadequate but is improving on the value trade. We previously added Industrials to our portfolio as performance has improved.
Current Positions: XLE, XLI
Outperforming – Materials (XLB), and Discretionary (XLY)
Over the last couple of weeks, we continued to suggest profit-taking in these holdings. These sectors remain extremely extended and overbought. Take profits and rebalance accordingly.
Current Positions: XLK, XLC
Weakening – Technology (XLK), and Communications (XLB)
We took profits previously in Technology due to the extreme extension and warned a correction was likely. That correction came, and we added back to our holdings after taking profits. Technology is weakening in terms of relative performance, but we may see a return to outperformance short-term.
Current Position: XLK, XLC
Lagging – Healthcare (XLV), Utilities (XLU), Real Estate (XLRE), and Staples (XLP)
Previously, we added to our core defensive positions Healthcare. We continue to hold Healthcare on a longer-term basis as it tends to outperform in tougher markets and hedges risk. Healthcare was sitting on support and oversold, and the counter-trend rally in Healthcare has come to fruition.
Our defensive positioning in Staples and Utilities continues to lag, but performance is improving. Utilities and Staples remain part of the “risk-off” rotation trade. Real Estate is also improving and coming back on our radar.
Current Position: XLU, XLV, XLP
Market By Market
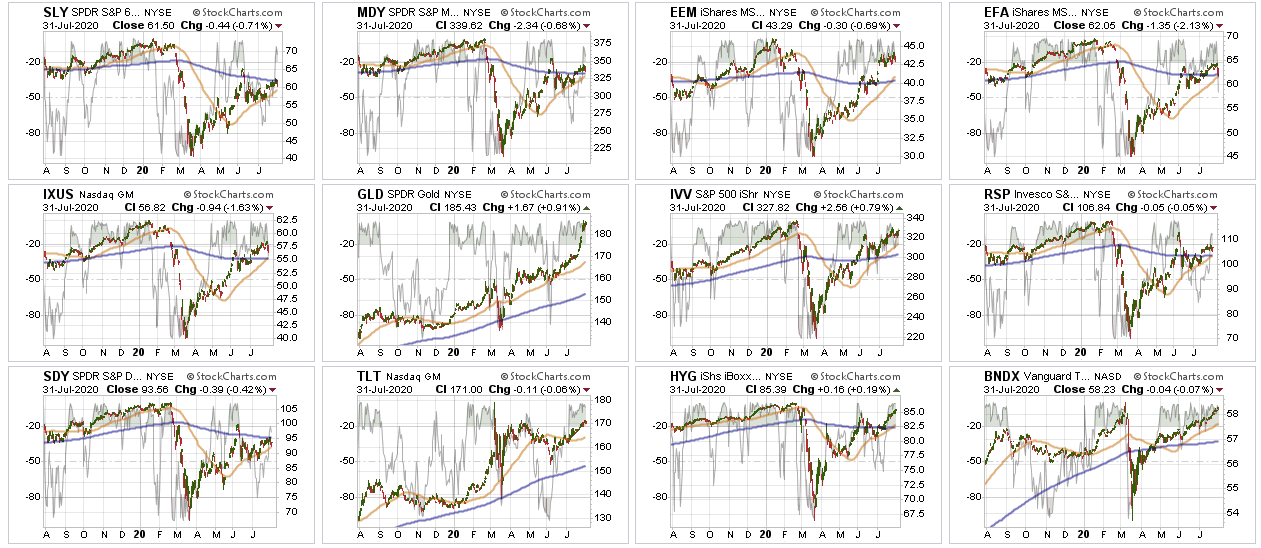
Small-Cap (SLY) and Mid Cap (MDY) – Both of these markets continue to underperform. Both markets are flirting with overhead resistance. We maintain no holdings currently.
Current Position: None
Emerging, International (EEM) & Total International Markets (EFA)
Emerging and International Markets have performed better recently. Last week, we closed our position in EFA as the dollar is setting up for a counter-trend rally. We will look to add international back to portfolios once the dollar reversal occurs.
Current Position: None
S&P 500 Index (Exposure/Trading Rentals) – We currently have no “core” holdings.
Current Position: None
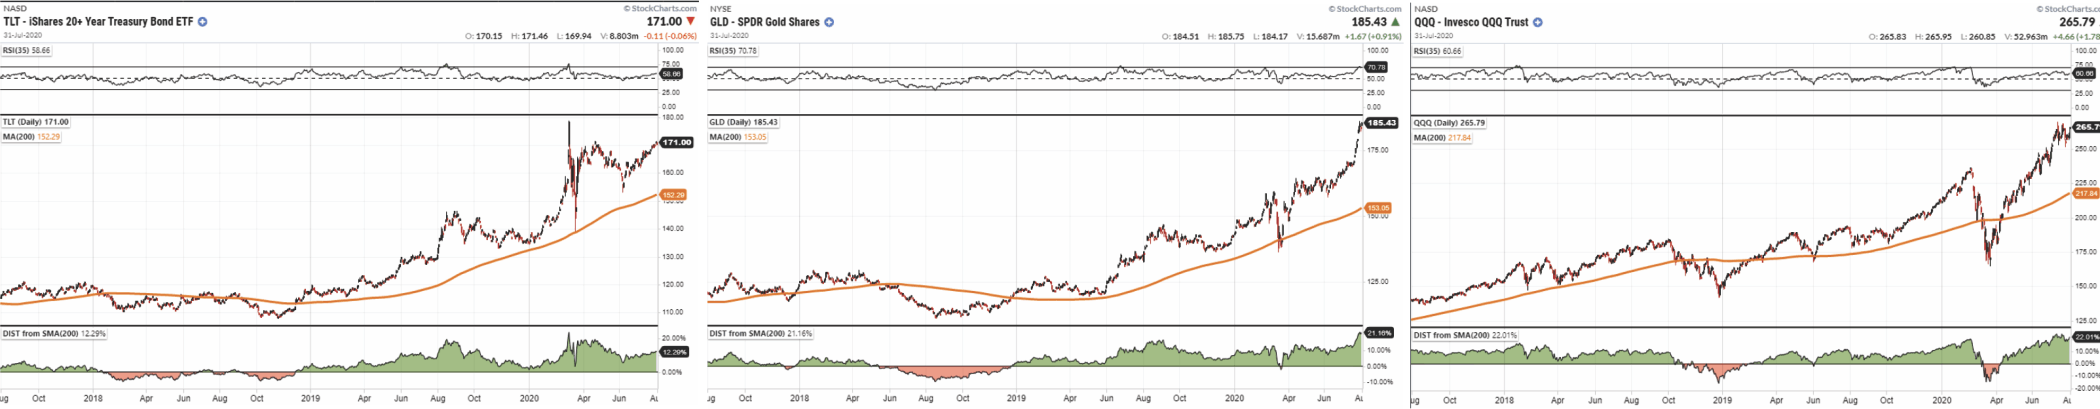
Gold (GLD) – Last week, we trimmed our exposure to IAU. Gold is a bit overbought short-term, so we are looking for a pullback to rebuild exposures. The Dollar is extremely oversold; we have added a small position in UUP to hedge downside risk in Gold.
Current Position: IAU, UUP
Bonds (TLT) –
We continue to hold our bond holdings as a hedge against market risk. However, those positions are starting to get very extended, so we will likely rebalance soon. No change this week.
Current Positions: TLT, MBB, & AGG
Portfolio / Client Update
With July now behind us, we are heading into two of the seasonally weak months of the year. Last week, we made changes to portfolios to rebalance risk, add a hedge, and shift exposures into protected areas against economic weakness.
We had taken profits previously in our technology holdings. We brought those holdings back up to size and reduced International, Industrials, and Transportation, which are subject to a weaker economy and rising dollar.
As noted in the main body of the newsletter this week, we also started building a position in the Dollar to hedge against a market decline. With stocks, bonds, gold, and commodities all very extended, a reversion is likely.
We suspect we may have a bit more “choppiness” ahead of us. Still, with the technical indicators more bullish than bearish, we are maintaining our equity exposure. Nonetheless, we also keep moving our “stops” up, just in case.
Changes
In both models, we added a small hedge in the Dollar (UUP) as it is extremely oversold. The purpose of this position is to hedge risk in our Energy, Gold, and International positions.
We also readjusted some weightings in both portfolios by adding a small amount of money to sectors we were underweight on relative to the S&P 500.
Equity Model:
- Added to our positions in AAPL, AMZN, MSFT, NFLX, ADBE, CRM.
- Sold our positions in EFA, RTX, and NSC.
ETF Model:
- Added to our position in XLK
- Sold our positions in EFA and EFG.
- Reduced positions in XLI, IYT
The purpose of these changes is to provide a bit more relative performance without markedly increased risk.
We had a good test of our portfolios on Thursday and Friday as portfolios provided outstanding relative performance versus the benchmark. Our hedges continue to work as expected, even with increased equity exposure.
In the meantime, we are doing our best to maintain some risk controls. We do not want to be forced to sell emotionally. Please don’t hesitate to contact us if you have any questions or concerns.
Lance Roberts
CIO
THE REAL 401k PLAN MANAGER
A Conservative Strategy For Long-Term Investors
If you need help after reading the alert; do not hesitate to contact me
Model performance is a two-asset model of stocks and bonds relative to the weighting changes made each week in the newsletter. Such is strictly for informational and educational purposes only and should not be relied on for any reason. Past performance is not a guarantee of future results. Use at your own risk and peril.

401k Plan Manager Live Model
As an RIA PRO subscriber (You get your first 30-days free) you have access to our live 401k plan manager.
Compare your current 401k allocation, to our recommendation for your company-specific plan as well as our on 401k model allocation.
You can also track performance, estimate future values based on your savings and expected returns, and dig down into your sector and market allocations.
If you would like to offer our service to your employees at a deeply discounted corporate rate, please contact me.


Lance Roberts is a Chief Portfolio Strategist/Economist for RIA Advisors. He is also the host of “The Lance Roberts Podcast” and Chief Editor of the “Real Investment Advice” website and author of “Real Investment Daily” blog and “Real Investment Report“. Follow Lance on Facebook, Twitter, Linked-In and YouTube
Customer Relationship Summary (Form CRS)
Also Read


