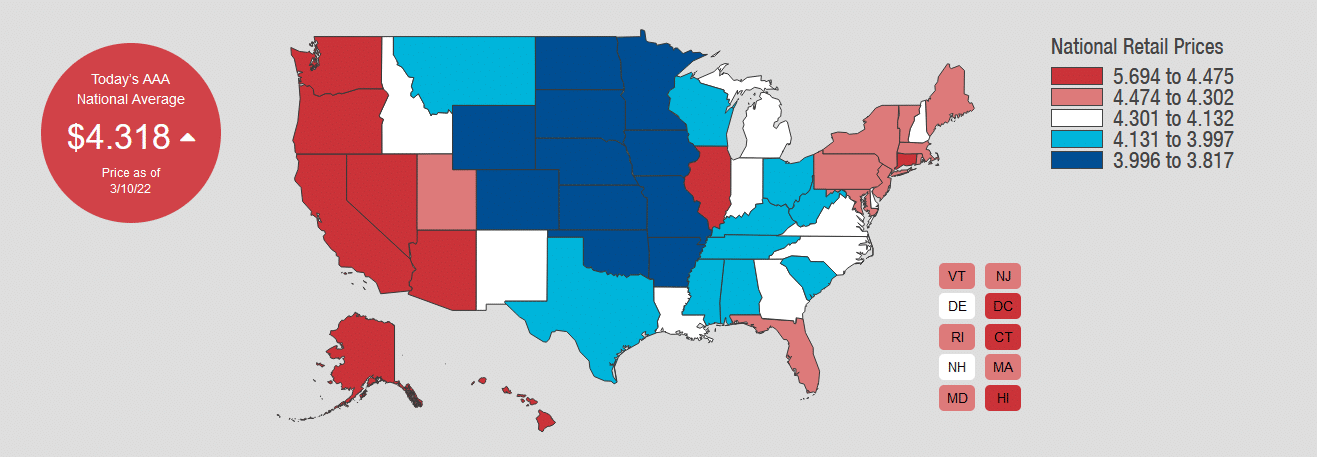
The CPI year-over-year inflation rate, propelled by rising gas and used car prices, rose to 7.9%, the highest level since 1982. The increased inflation rate comes the day after the Fed officially ended the latest round of QE. Next on the monetary policy docket is the Fed meeting on Wednesday. Investors worldwide will watch intently to see how they plan on raising rates and reducing their balance sheets to tackle inflation. The European Central Bank (ECB), also dealing with high inflation rates, was particularly hawkish Thursday morning. Markets were expecting a dovish tone due to the adverse economic effects of war and their proximity to the invasion. In their case, inflation seems to be taking precedence over weaker economic activity.

What To Watch Today
Economy
- 10:00 a.m. ET: University of Michigan sentiment, March preliminary (62.5 expected, 62.8 in February)
Earnings
- WeWork (WE) is expected to report results before market open
Market Fails Retest Of Broken Lows
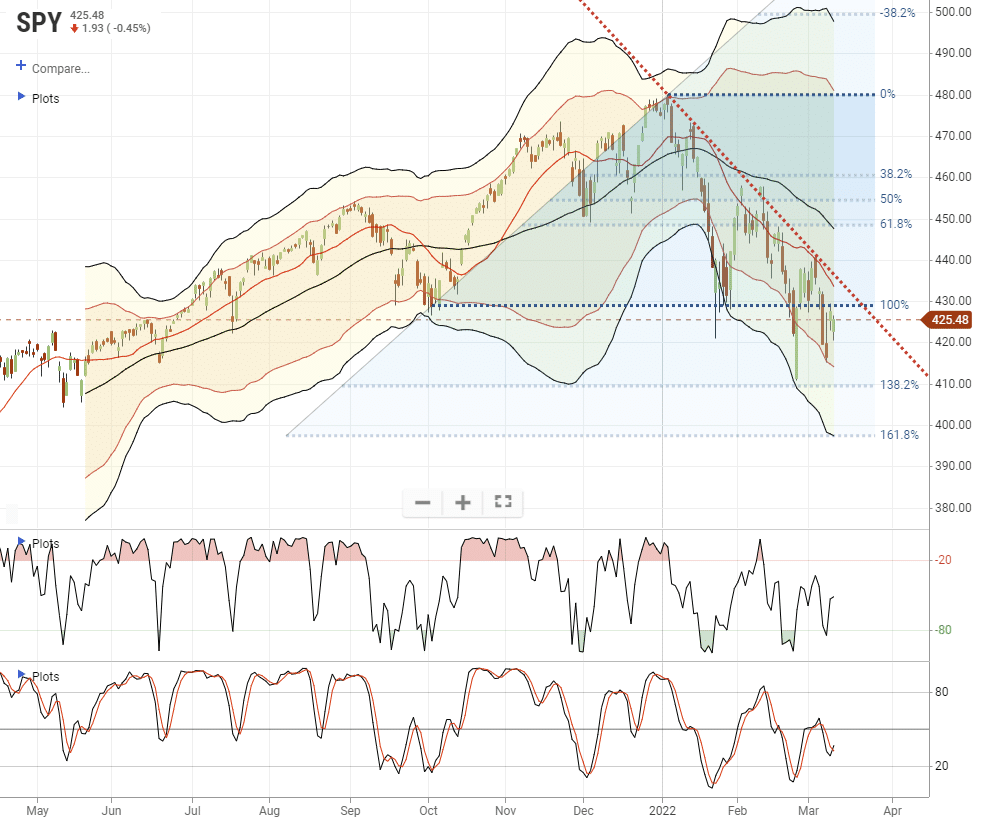
On Tuesday, the market broke the January/September lows. However, the sharp rally on Wednesday failed to close above those lows with the decline on Thursday suggesting a failure at resistance. If the market does not reclaim the January lows by the end of the week, pressure will mount for a restest of the Russian invasion lows.
The downtrend line from the January highs is currently intersecting with the 20-dma which puts a LOT of resistance just above current price levels. However, with that said, there is a tremendous amount of negative sentiment and positioning which is prime to elicit an unexpected short-squeeze rally on any good news which could carry markets to the 50-dma. That news could be a drop in the inflation rate, a more dovish Fed, or a resolution in Ukraine. We continue to remain underweight equity risk for now.
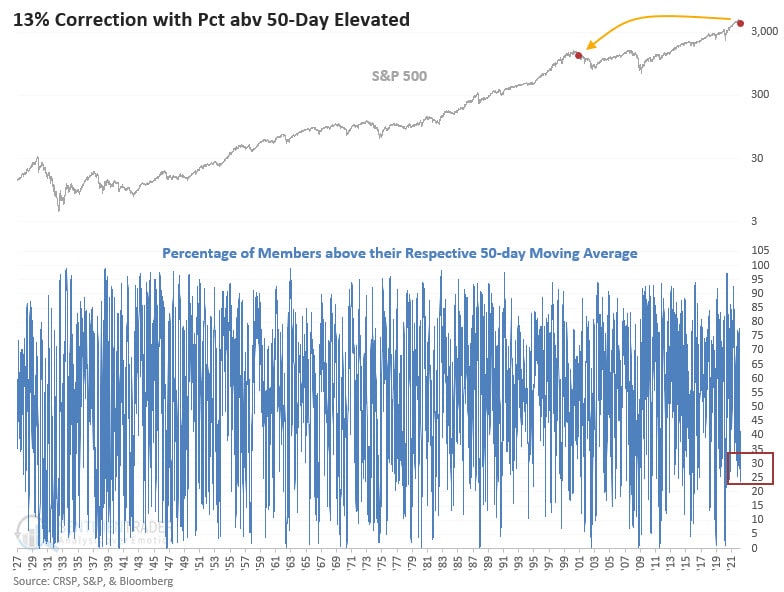
More Pain Ahead for the S&P 500?
Per Dean Christians at Sundial Capital Research, “It’s highly unusual to see the SPX correct this much and still have over 23% of its members above their respective 50-day average. I can find only two instances since 1927—Tuesday, March 8th, and November 2000. Corrections and bear markets typically end when all stocks capitulate.”
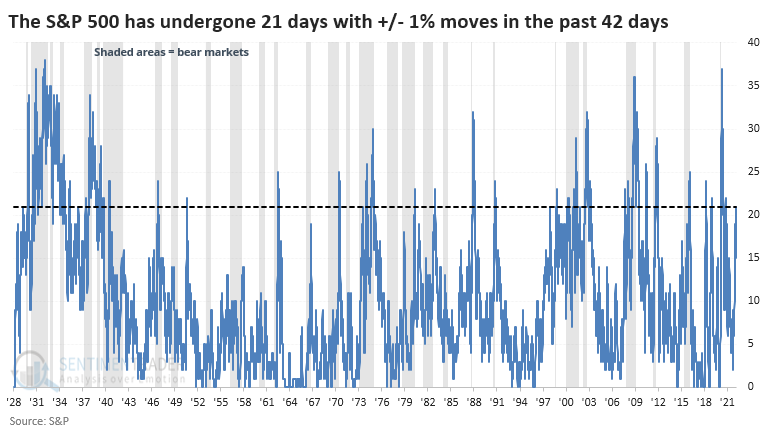
Lots Of Volatility
“It gets noisy as we zoom out, but going back to 1928, it looks like pretty much the same thing. But there were 3,038 days when the rolling count of 1% days met or exceeded 20, and 1,397 of those days were during bull markets. So, if we were witnessing a big cluster of 1% daily swings, there was still a 46% chance we were in a bull market environment (note that many of those occurred at the end of bear markets and the start of new bull markets).
If stocks enter a period of high volatility, with more than 20 days of 1% swings during a 2-month span, then it didn’t necessarily mean a bear market was imminent. In fact, it never did. Stocks eventually fell into a bear market after the signals in 1973, 2000, and 2007, but not before rebounding first.” – Sentiment Trader
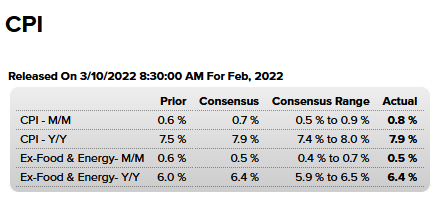
CPI
As we show below CPI rose .8% in February, slightly above expectations for a .7% increase. That equates to a 9.6% annualized rate of inflation and is moderately higher than the 7.9% year-over-year reported rate. The rest of the CPI data fell in line with expectations. There are two factors worth considering when looking forward.
The effects of the Russian invasion are not yet factored into yesterday’s data. Over the next few months, we will see higher food and energy prices resulting from the sanctions on Russia. This will undoubtedly provide an upward inflationary bias. Food prices grew 1% in yesterday’s report. Again that is before the recent surge in many food commodity prices.
The good news is the math behind the year-over-year calculations will help keep a lid on inflation. Starting in March of 2021, inflation started rising appreciably. Therefore, as we advance, and compare current inflation to a year ago, the difference will be less stark than it has been. As a result, the year-over-year inflation rate should stabilize, assuming prices do not spike further. To appreciate the math, consider that the inflation rate for last February was .4%. In Thursday’s CPI report, that number was thrown out of the year-over-year calculation and replaced with .8%. That accounts for the increase from 7.5% to 7.9%. The monthly CPI data for March through June of 2021 ranged between 0.6% and 0.9%. Those are much more aligned with current monthly rates of inflation which will help stabilize year-over-year calculations.
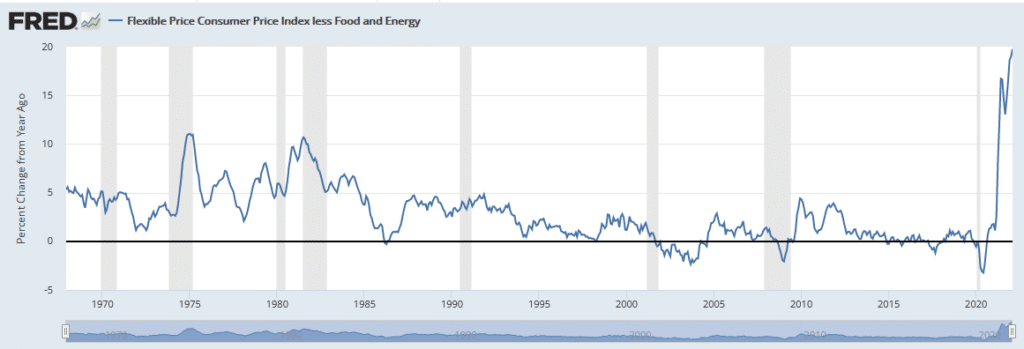
More CPI
The graph below charts the stunning increase in flexible prices, excluding food and gas. These are goods and services whose prices change frequently. They are also quick to react to changes, such as today’s events. The graph provides hope that slower economic growth and further normalization of supply lines will dampen demand and increase supply for many of these products.
Will the Fed Follow The ECB’s Hawkish Tracks?
On Thursday, the ECB came out with a more hawkish tone than expected at its monetary policy meeting. While they didn’t raise rates, they did commit to tapering QE and ending it in the third quarter. The market now expects the ECB to hike rates by .45bps this year, starting in October. Interestingly there is little mention of the effect of the Russian invasion on European growth.
Essentially, the ECB lays the groundwork for tighter policy due to sharply rising inflation. To that end, Italian PPI rose 12.8% for February, bringing the year-over-year rate to 41.8%. Led by Italy, shown below, bond yields around the world rose sharply on the ECB’s statement. All eyes turn to the Fed’s FOMC meeting next Wednesday.

Please subscribe to the daily commentary to receive these updates every morning before the opening bell.
Also Read