


When markets begin to decline, particularly after extremely long periods of advances, there is a rush by the media and financial bloggers to proclaim “patience.” These claims are generally accompanied by advice to just “hold on” to investments and ride out the volatility over the long-term. After all, the index always rises, right?
The problem, is that market indices and investor portfolios are two very different things and there are a few very important things to consider before “jumping off this particular cliff.”
One of the most important fallacies of benchmarking portfolios, as I addressed recently, is the disparity between compound and variable rates of return. To wit:
“The ‘power of compounding’ ONLY WORKS when you do not lose money. As shown, after three straight years of 10% returns, a drawdown of just 10% cuts the average annual compound growth rate by 50%. Furthermore, it then requires a 30% return to regain the average rate of return required. In reality, chasing returns is much less important to your long-term investment success than most believe.
Here is another way to view the difference between what was “promised,” versus what “actually” happened. The chart below takes the average rate of return, and price volatility, of the markets from the 1960’s to present and extrapolates those returns into the future.”
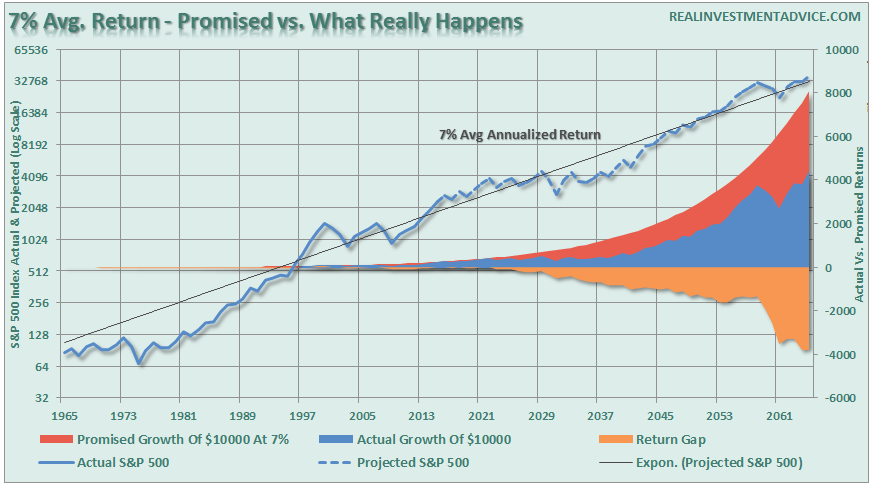
“When imputing volatility into returns, the differential between what investors were promised (and this is a huge flaw in financial planning) and what actually happened to their money is substantial over the long-term.
The second point, and probably most important, is that YOU DIED long before you realized the long-term average rate of return.”
Most importantly, as noted above, the of “TIME” is critical to the investing equation. While 10% annualized returns sound fantastic, those returns were over the course of more than 100 years and included an average dividend yield of almost 4%. Unfortunately, you will not live long enough to realize those “average rates of return.”
I want to specifically address the fallacy of chasing a benchmark index (i.e. the S&P 500.) The continual chase to “beat the benchmark” leads individuals to make emotional decisions to buy and sell at the wrong times; jump from one investment strategy to another, or from one advisor to the next. But why wouldn’t they? This mantra that has been drilled into all of us by Wall Street over the last 30 years. While the chase to “beat the index” is great for Wall Street, as money in motion creates fees and commissions, most individuals have done far worse.
The annual studies from Dalbar show the dismal truth, individuals consistently under perform the benchmark index over EVERY time frame.
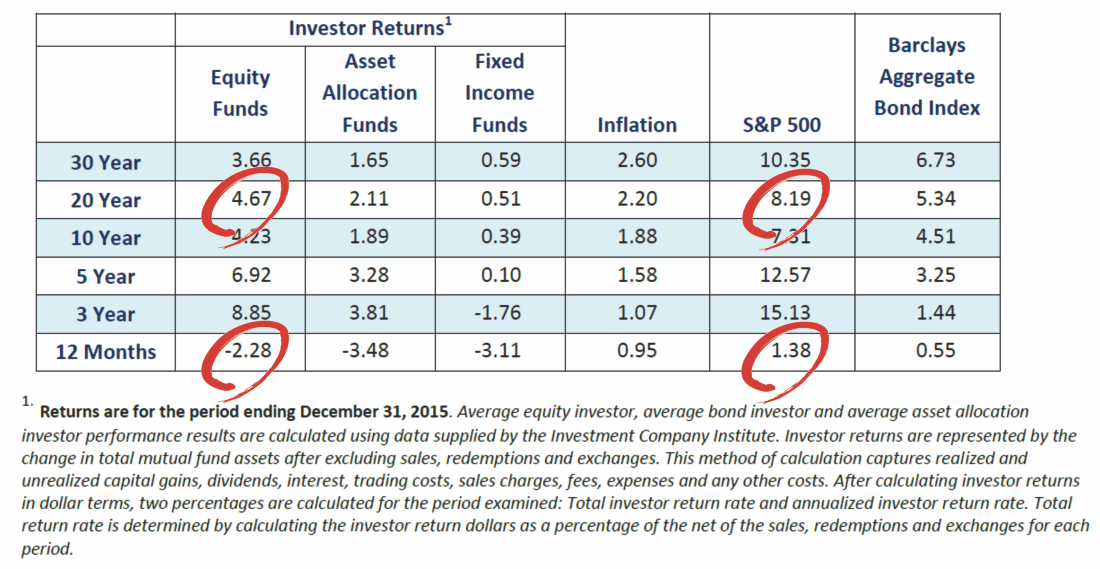
The reason this underperformance consistently occurs is due to emotional mistakes and the many factors that affect a “market capitalization weighted index” far differently than a “dollar invested portfolio.”
Let’s set aside the emotional mistakes for today and focus on the differences between a benchmark index and your portfolio.
Building The Sample Index
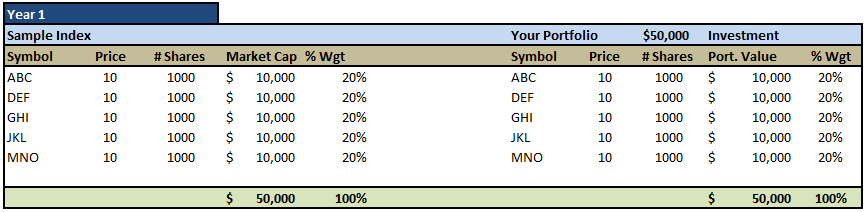
For example purposes, let’s create a very simplistic index called the Sample Index which is comprised of 5 fictional companies. For this purpose, each company has 1000 shares of stock outstanding and all trade at $10 per share. The table below shows the index versus “Your Portfolio” which is a $50,000 investment weighted equally.
I have also labeled each of the six following examples as year 1, 2, etc. so that I can give you a performance chart at the end of this missive.
In Year 1, our starting point, we divide a $50,000 investment into exactly the same weights and stocks as the Sample Index as follows:
There are a couple of caveats here. The first is that by using so few stocks the percentage changes to the index, and subsequently the portfolio, are going to be amplified. However, this only for informational and learning purposes – it is the concept we are after.
Secondly, there are many other factors, outside of the examples covered here, which have major impacts on performance. Events such as mergers, buyouts, and acquisitions affect the index. Your portfolio is impacted by withdrawals and contributions. Also, the example assumes no dividends which would change portfolio performance.
Lastly, and most importantly, none of the examples today include the significant impacts to portfolio performance over time which comes from taxes, fees, commissions and other expenses. These factors alone can account for a bulk of the underperformance over the long term but are often ignored by investors trying to chase some random benchmark index.
The Status Quo
In the second year of our example – we assume that nothing exceptional, other than just normal price appreciation or depreciation. The table below shows the impact of price changes on both the Sample Index and Your Portfolio.
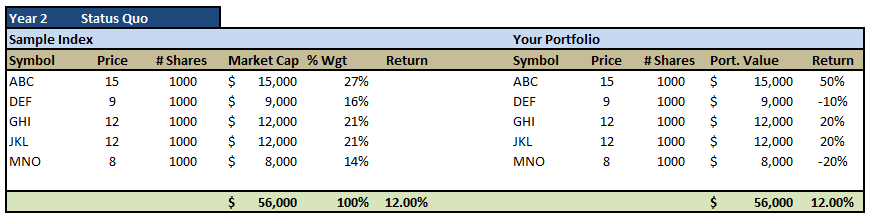
Not surprisingly, since both the index and the portfolio are directly affected by price changes – the performance between the two is identical. However, in the real world such a “stagnant” situation rarely exists over a twelve month period.
Share Buybacks & Bankruptcy
Since the end of the last recession, corporations have become major buyers of their own stock pushing such actions to record levels. Stock buybacks are typically viewed as a good thing by Wall Street analysts supposedly because it is a sign that the “company believes” in itself, however, nothing could be further from the truth.
The reality is that stock buy backs are a tool used to artificially inflate bottom line earnings per share which, ultimately, drives share prices higher.
The importance of buybacks cannot be overlooked. The dollar amount of sales, or topline revenue, is extremely difficult to fudge or manipulate. However, bottom line earnings are regularly manipulated by accounting gimmickry, cost cutting, and share buybacks to enhance results in order to boost share prices and meet “Wall Street Expectations.”
Let me show you a simple mathematical example.
The first table and chart below show sales for a hypothetical company over a 5 year period. The sales are stagnant at $10,000 a year.
Look at what happens to Sales/Share and Earnings/Share as the amount of outstanding stock is reduced.
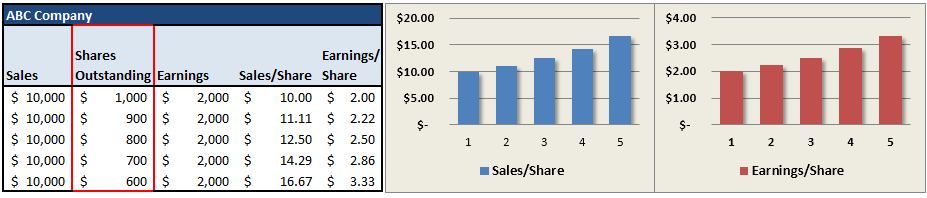
If you were only looking at the two charts, you would assume that this stock was growing strongly. In reality, it did not grow AT ALL over a 5-year period.
Let’s look at the same example but this time let’s reduce sales and earnings for the company at the same time we are buying back stock.
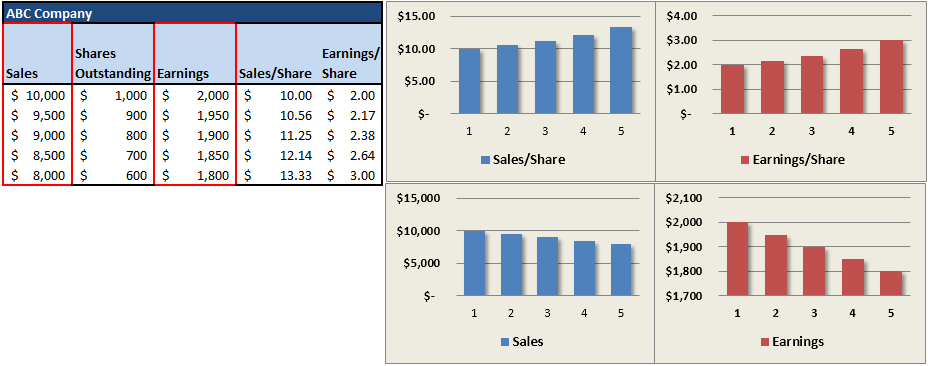
As you can see – once again if you only looked at the charts of Sales/Share and Earnings/Share, the latter being the main focus of Wall Street, you would have been lured into thinking this was a strongly growing company. However, in reality, sales and earnings were deteriorating but masked by the reduction in outstanding shares. Stock buybacks DO NOT show faith in the company by the executives but rather a LACK of better ideas for which to use capital for.
Importantly, for our overall example, the reduction in outstanding shares ALSO reduces market capitalization.
Let’s go back to our original index and portfolio example.
In year 3, there are THREE events that occur which impact both the index and our portfolio.
- Company DEF buys back 50% of their outstanding shares
- Company MNO files for bankruptcy.
- Each company experiences a change in share price.
The table below shows the impact of these three events on the index and the portfolio.
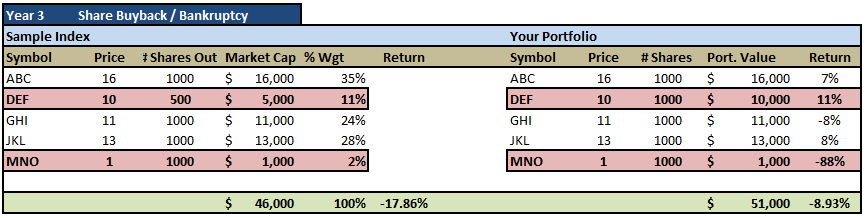
Notice that the share buyback and the bankruptcy combined cause market capitalization of the index to collapse by almost 18%. However, the dollar loss to your portfolio is roughly only 9%.
This reduction in market capitalization of Company DEF did nothing to change the price or number of shares owned on a dollar basis in your portfolio. However, the collapse in the stock of Company MNO as it filed for bankruptcy resulted in a significant loss of investor principal.
Substitution Effect
This brings us to the “substitution effect.” This is something that is rarely talked about to investors who are chided to chase the financial markets at their own peril.
When a company such as GM, AIG, Enron, Worldcom, and a host of others in history, goes bankrupt they are swapped out of the index for another company. The index is then reweighted for the “substitution.” The table below shows the impact of the substitution on the index and your portfolio.
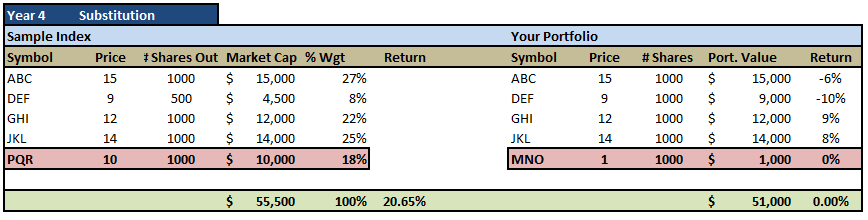
The substitution immediately provides a positive push to the index due to the boost in market capitalization. However, your personal investment portfolio does not see such a positive effect. On a dollar-weighted basis, the bankrupt company still weighs on the value of the total portfolio.
In order for you to get your portfolio back into alignment with the Sample Index, the stock of MNO Company must be sold and then replaced with PQR.
The Replacement Effect
The replacement of a stock in your actual portfolio is confronted by a problem. Since there is no cash in the portfolio, other than what was raised by the sell of MNO – only 100 shares of PQR can be purchased as shown in the table below.
As with each year previously I have also included changes in price for each individual company other than PQR so that the substitution and replacement were done at the same price for example purposes.
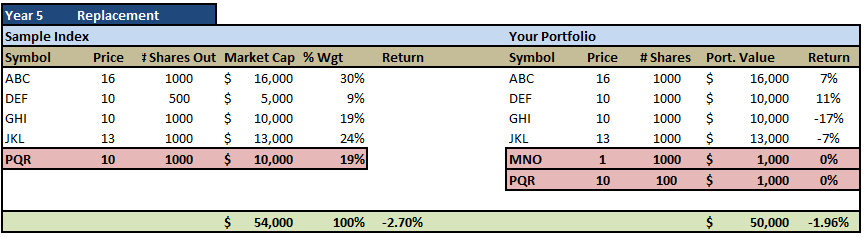
Note: Yes, I could have rebalanced the portfolio to raise cash to purchase more shares of PQR, however, we have NOT rebalanced the index. Therefore, using just available cash is the appropriate measure.
If you take a look at the Year 4 table above you will see that both the index and your portfolio declined by $1000 in total between year 4 and 5. However, the decline of the index was -2.7% versus only -1.96% for your portfolio. This is specifically due to the fact that your portfolio is $4000 less than the index at this point.
What About Performance?
Comparison in the financial arena is the main reason clients have trouble patiently sitting on their hands, letting whatever process they are comfortable with work for them. They get waylaid by some comparison along the way and lose their focus. If you tell a client that they made 12% on their account, they are very pleased. If you subsequently inform them that ‘everyone else’ made 14%, you have made them upset. The whole financial services industry, as it is constructed now, is predicated on making people upset so they will move their money around in a frenzy. Money in motion creates fees and commissions. The creation of more and more benchmarks and style boxes is nothing more than the creation of more things to COMPARE to, allowing clients to stay in a perpetual state of outrage.”
This could not be more to the point than anything that we have discussed today. Comparison of your performance to an index is the most useless, and potentially dangerous, thing that you can do as an investor.
The issues of stock buybacks, the “substitution effect”, taxes, expenses and fees all lead to underperformance of the index. Repeated studies have shown that roughly only 1 in 4 mutual fund managers outperform the market index over long periods of time. Of those that outperformed, the average outperformance was just .12% before fees and expenses. However, the fees and expenses were larger than the level of outperformance. This, of course, does not also include the tax impact on gains and income.
The problem with chasing performance, of course, is that once you fall behind you take on MORE risk to try and make up the difference. This leads, ultimately, to bigger mistakes that cost investors dearly.
The major learning points regarding the fallacy of chasing a “benchmark index” are:
1) The index contains no cash
2) It has no life expectancy requirements – but you do.
3) It does not have to compensate for distributions to meet living requirements – but you do.
4) It requires you to take on excess risk (potential for loss) in order to obtain equivalent performance – this is fine on the way up, but not on the way down.
5) It has no taxes, costs or other expenses associated with it – but you do.
6) It has the ability to substitute at no penalty – but you don’t.
7) It benefits from share buybacks – but you don’t.
In order to win the long-term investing game, your portfolio should be built around the things that matter most to you.
– Capital preservation
– A rate of return sufficient to keep pace with the rate of inflation.
– Expectations based on realistic objectives. (The market does not compound at 8%, 6% or 4%)
– Higher rates of return require an exponential increase in the underlying risk profile. This tends to not work out well.
– You can replace lost capital – but you can’t replace lost time. Time is a precious commodity that you cannot afford to waste.
– Portfolios are time-frame specific. If you have a 5-years to retirement but build a portfolio with a 20-year time horizon (taking on more risk) the results will likely be disastrous.
The index is a mythical creature, like the Unicorn, and chasing it takes your focus off of what is most important – your money and your specific goals. Investing is not a competition and there are horrid consequences for treating it as such.
Lance Roberts

Lance Roberts is a Chief Portfolio Strategist/Economist for Clarity Financial. He is also the host of “The Lance Roberts Show” and Chief Editor of the “Real Investment Advice” website and author of “Real Investment Daily” blog and “Real Investment Report“. Follow Lance on Facebook, Twitter, and Linked-In

Lance Roberts is a Chief Portfolio Strategist/Economist for RIA Advisors. He is also the host of “The Lance Roberts Podcast” and Chief Editor of the “Real Investment Advice” website and author of “Real Investment Daily” blog and “Real Investment Report“. Follow Lance on Facebook, Twitter, Linked-In and YouTube
Customer Relationship Summary (Form CRS)
Also Read


