In this 11-19-21 issue of “FOMO Rises As Investors Push Risk For Gains.”
- Market Consolidates Gains Near Highs
- FOMO Is Evident As Investors Chase Returns
- The Next Financial Crisis
- Portfolio Positioning
- Sector & Market Analysis
- 401k Plan Manager
Follow Us On: Twitter, Facebook, Linked-In, Sound Cloud, Seeking Alpha
Is It Time To Get Help With Your Investing Strategy?
Whether it is complete financial, insurance, and estate planning, to a risk-managed portfolio management strategy to grow and protect your savings, whatever your needs are, we are here to help.
Schedule your “FREE” portfolio review today.
Market Consolidates Gains Near Highs
FOMO is back. Previously, we discussed the speculative nature of the market, from record call option activity to historical highs in equity allocations. However, such occurs when the Fed is tapering bond purchases, futures are predicting three rate hikes, and inflation is surging.
There seems to be nothing that can derail this “freight train.” Consequently, such is usually about the time something happens. For now, we are maintaining our equity exposure as the consolidation of October’s advance continues. As shown, our biggest concern has been the absolute lack of volume during the recent advance.

Furthermore, the MACD “sell signal” remains; however, the money flow signal is nearing oversold. Such suggests the market will likely remain weak near-term. As noted in Friday’s Daily Market Commentary (click the banner below to subscribe):
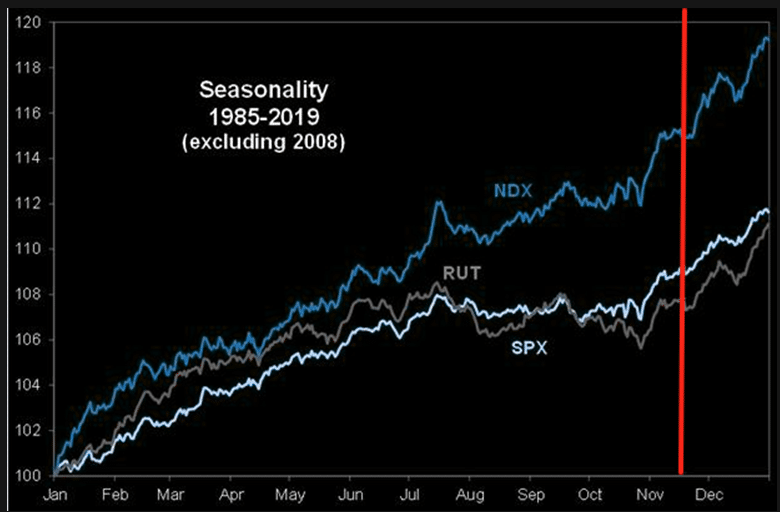
“Seasonality is strong this year as stocks push higher. However, note the first two weeks of December tend to sport a correction as Mutual Funds distribute capital gains for the year. That pullback would set up for the traditional rally to close out the year.”
The only concern we have is the lack of breadth as of late. As shown, the number of stocks above the 50-dma turned sharply lower this week. Furthermore, they are well below levels when markets typically make new highs. The same goes for the number of stocks trading above their 200-dma’s.
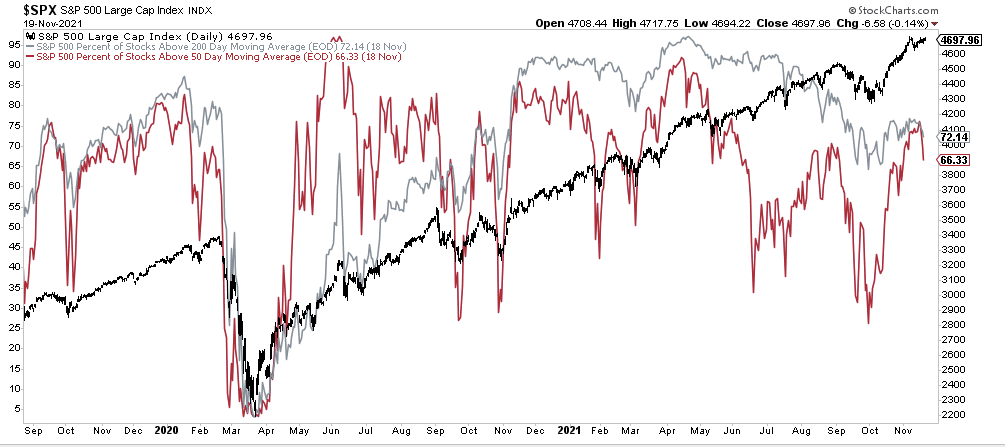
Notably, downturns in breadth were previously often aligned with market corrections. It is the flood of money into FAANG stocks keeping the markets elevated. So, while the lack of breadth in the short-term may not seem problematic, in the longer term, it likely will be.
As Bob Farrell quipped:
“Investors tend to buy the most at the top, and the least at the bottom.”
But as stated, for now, it’s all about FOMO.

FOMO Rises As Investors Chase Gains
Last week, we touched on some of the excesses building in the market as investors continue to pile into risk. To wit:
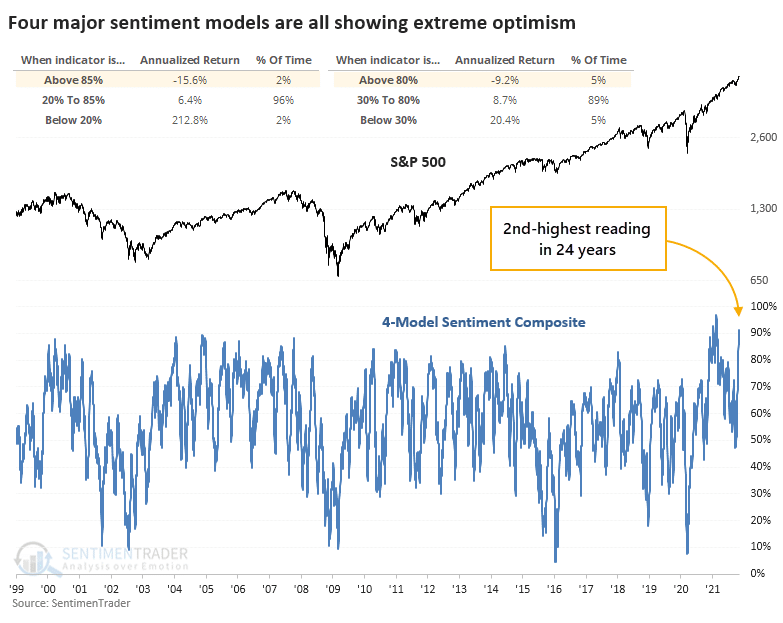
The chart shows us that the S&P 500’s annualized return when the composite model was above 80% was a miserly -9.2%. When the model was above 85%, accounting for about 2% of all days since 1998, that return was a horrid -15.6%.”
With the market up 25% in 2021, investors have a more significant “Fear Of Missing Out,” or FOMO, than they do of losing money. Such speculative activity is apparent in the volume of inflows into leveraged ETFs to bolster market returns.
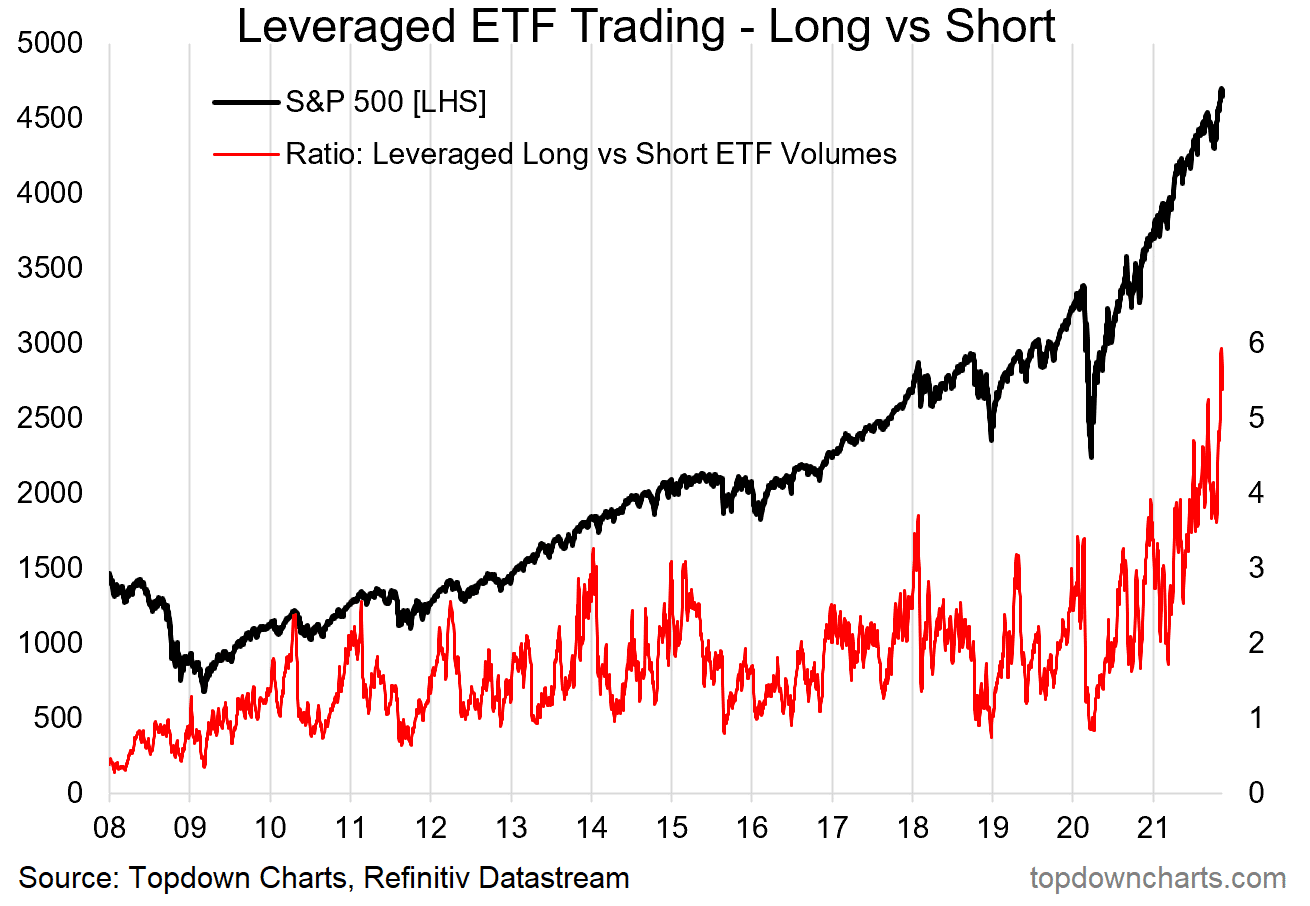
During very late-stage bull markets, the speculative frenzy of investors to chase returns is not uncommon. At the peak of every bull market cycle in history, we witnessed the same. Furthermore, in recent decades, we can measure such exuberance by the magnitude of “leverage” individuals take on to chase markets.
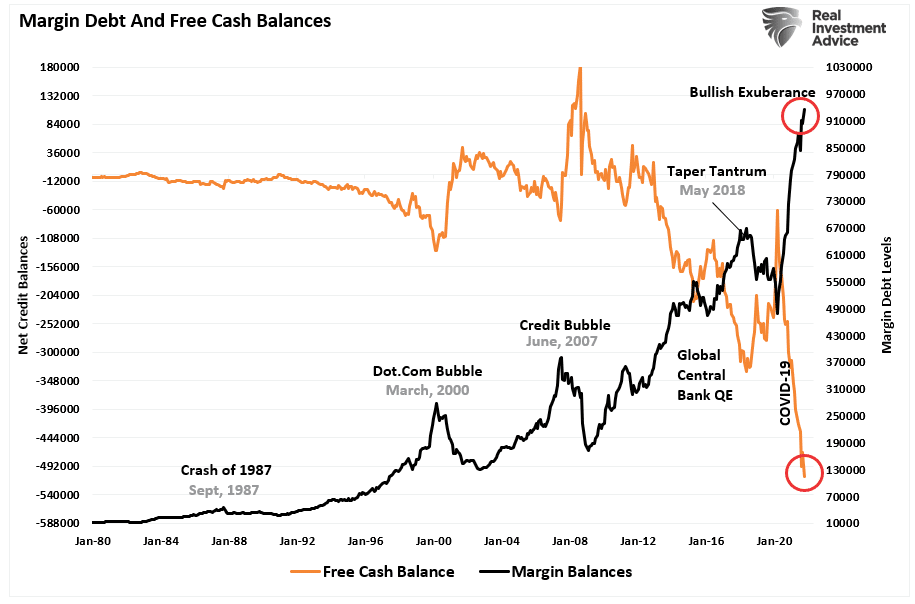
Of course, the critical thing about “margin debt” is that it fuels the bullish advance. But, unfortunately, it also accelerates the market’s eventual decline as leverage reverses. Such is always a brutal and mauling event, which is why it is called a “bear market.”
The only question is what causes investor sentiment to switch from FOMO to GTFO (Get The $*^# Out!)

The Next Financial Crisis
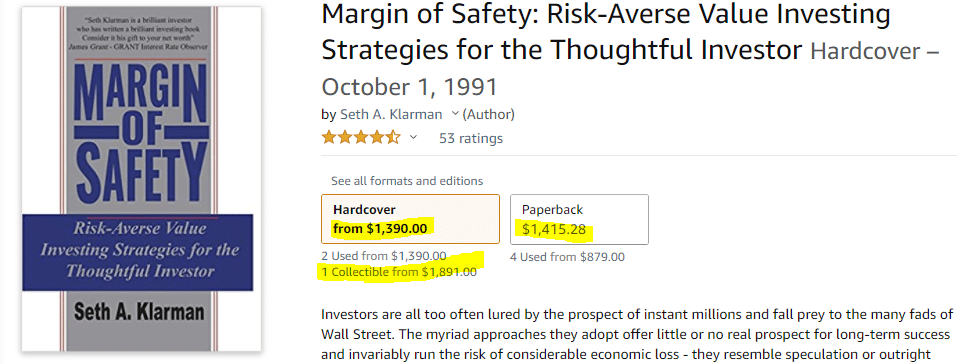
While investors remain engulfed in FOMO, serious issues are brewing within the fundamental underpinnings of the market. In Seth Klarman’s famous book, “A Margin Of Safety,” he discussed the 1980’s bond mania before it imploded. That book today will cost you dearly.
At that time, many companies issued bonds even though they could not afford to pay the interest expenses. Today, such a company gets nicknamed a “zombie.” Such is when a company must feed on cheap debt to stay alive. Currently, the market capitalization of these zombie firms is at a record.
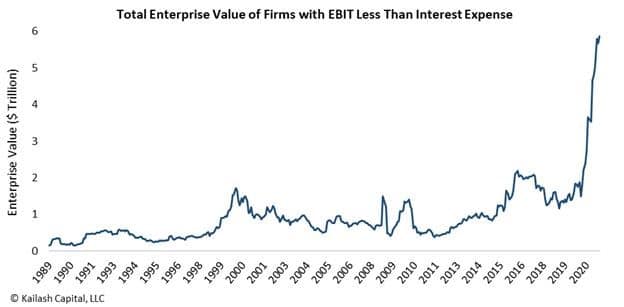
The obvious problem is what happens if interest rates rise to a level where they cannot refinance their debt.
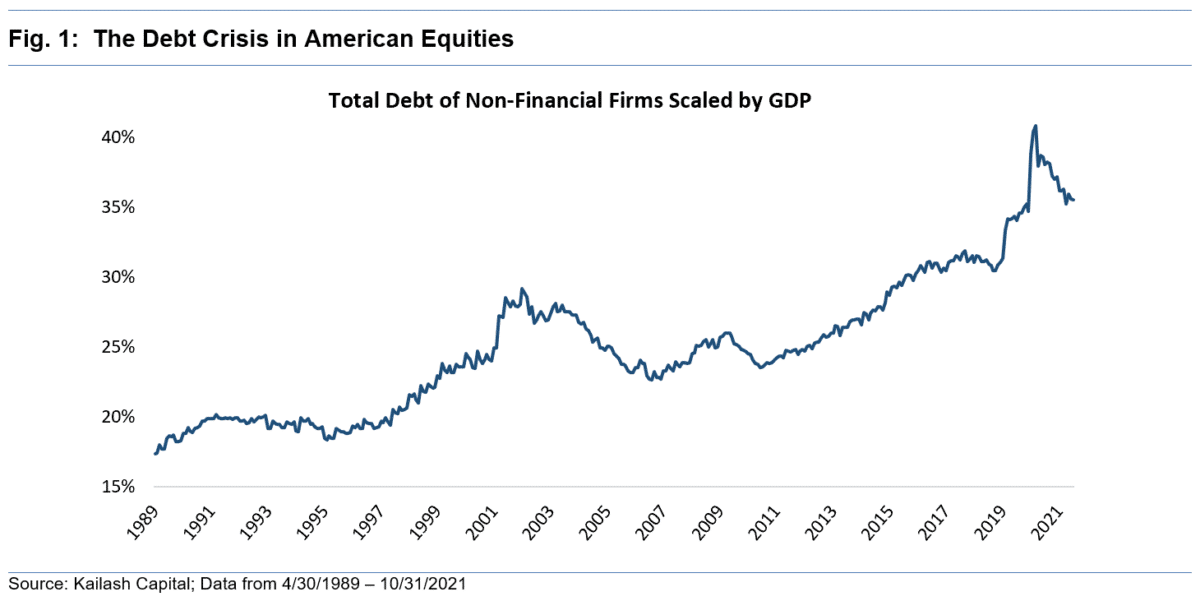
Unfortunately, as Kailash Concepts explains, debt itself is the problem.
“We don’t understand why others are not alarmed by an ‘anything goes’ attitude towards record levels of leverage where interest expense cannot be paid for by profits. Currently, the world is awash in financial alchemy.
Since 2007, a big part of America’s debt crisis has moved from the financial sector to non-financial stocks with too much debt. We believe the mix of record debt and record equity valuations is likely a side effect of real rates approaching lows last seen in 1973. Whether we are right or wrong on the causality, the facts are intimidating in our view.
Our research has documented that the world has never been less prepared or less equipped to deal with a possible outbreak of inflation or pull-back in Federal largess.
If interest rates rise, the Fed tightens monetary policy, or the economic recovery falters, the seeds for the next financial crisis have already gotten sown.
In Case You Missed It
The Stability / Instability Paradox
Over the last decade, the Fed’s monetary policy trained investors to take on increasing levels of risk. Each crack in the “financial foundation” got met with monetary injections. Moreover, the “stability” provided by the Fed’s interventions bolstered investors’ FOMO.
Interestingly, the Fed is dependent on market participants believing in this idea. As noted above, with the entirety of the financial ecosystem more heavily levered than ever, the “instability of stability” is the most significant risk.
The “stability/instability paradox” assumes all players are rational and implies avoidance of destruction. In other words, all players will act rationally, and no one will push “the big red button.”
The Fed is highly dependent on this assumption. After more than 12-years of the most unprecedented monetary policy program in U.S. history, they are attempting to navigate the risks built up in the system.
Simply, the Fed is dependent on “everyone acting rationally.”
Unfortunately, such has never been the case.
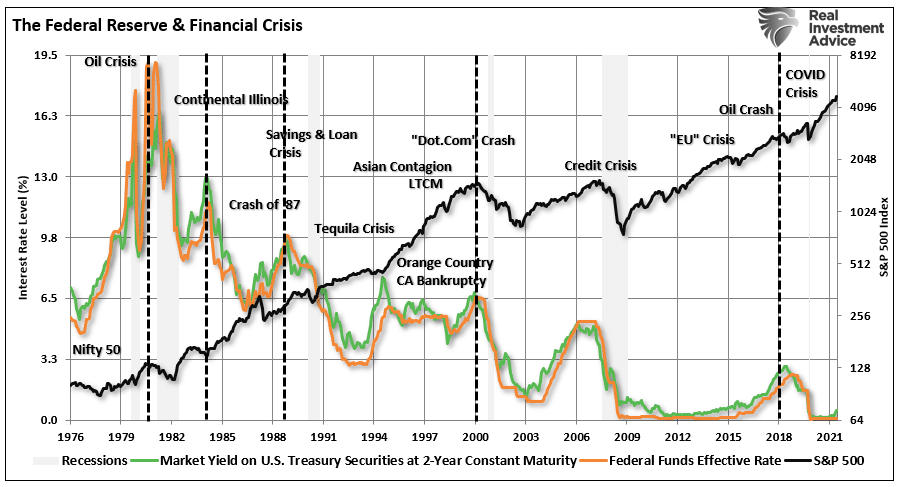
The behavioral biases of individuals remain the most serious risk facing the Fed. Throughout history, the Fed’s actions have repeatedly led to adverse outcomes despite the best of intentions.
- In the early 70’s it was the “Nifty Fifty” stocks,
- Then Mexican and Argentine bonds a few years after that
- “Portfolio Insurance” was the “thing” in the mid -80’s
- Dot.com anything was a great investment in 1999
- Real estate has been a boom/bust cycle roughly every other decade, but 2007 was a doozy
- Today, it’s real estate, FAANNGT, debt, credit, private equity, SPAC’s, IPO’s, “Meme” stocks…or rather…”everthing.”
After the Fed inflated the most prominent financial bubble in history, they now want to reduce liquidity and hike interest rates.
They are hoping no one pushes the “big red button.”
“Only those that risk going too far can possibly find out how far one can go.” – T.S. Eliot

Portfolio Update
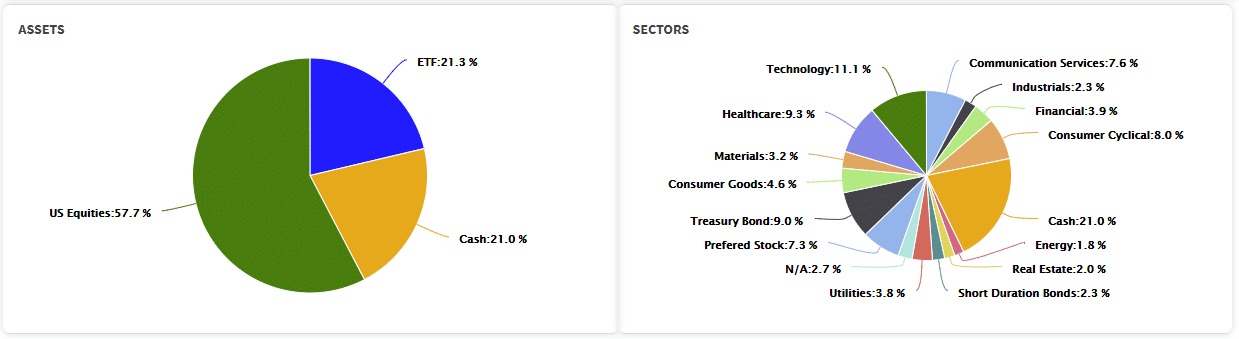
Given the more exceeding levels of FOMO in the market currently, we remain weighted towards equity risk. Therefore, from a portfolio management standpoint, we must continue to press for portfolio returns for clients. However, don’t mistake that as a disregard for the underlying risk.
Over the last two weeks, we took profits in overbought and extended equities. We also shortened our bond duration by trimming our longer-duration holdings. Such actions rebalanced portfolio risk short-term. In addition, we run a 60/40 allocation model for our clients; such left us slightly underweight equities and bonds and overweight cash.
As noted last week,
“In the meantime, we remain a bit more bullishly biased than we like. However, sometimes, being ‘uncomfortable’ is just part of the investment process.”
Such remains the case this week. For now, the bullish bias is strong. We are also in the “seasonally strong” period of the year, and the seemingly endless supply of money continues to flood into equities.
Those forces are powerful, and trying to fight them has been a futile and costly exercise. Such was a point made this past week as Michael Burry closed out all of his bearish positions. Furthermore, Russell Clark of Russell Clark Investment Management tagged the world’s most bearish hedge fund, shut down entirely.
We remain focused on the risk of what can, and will, eventually destroy unimaginable amounts of capital. However, we will continue to participate in markets while they are rising.
Just be aware we are sitting very close to the exit of this particular theatre.
“May The FOMO Be With You.”
Have a great weekend.
By Lance Roberts, CIO
Market & Sector Analysis
Analysis & Stock Screens Exclusively For RIAPro Members
S&P 500 Tear Sheet

Performance Analysis
Technical Composite
The technical overbought/sold gauge comprises several price indicators (RSI, Williams %R, etc.), measured using “weekly” closing price data. Readings above “80” are considered overbought, and below “20” are oversold. The current reading is 85.65 out of a possible 100.

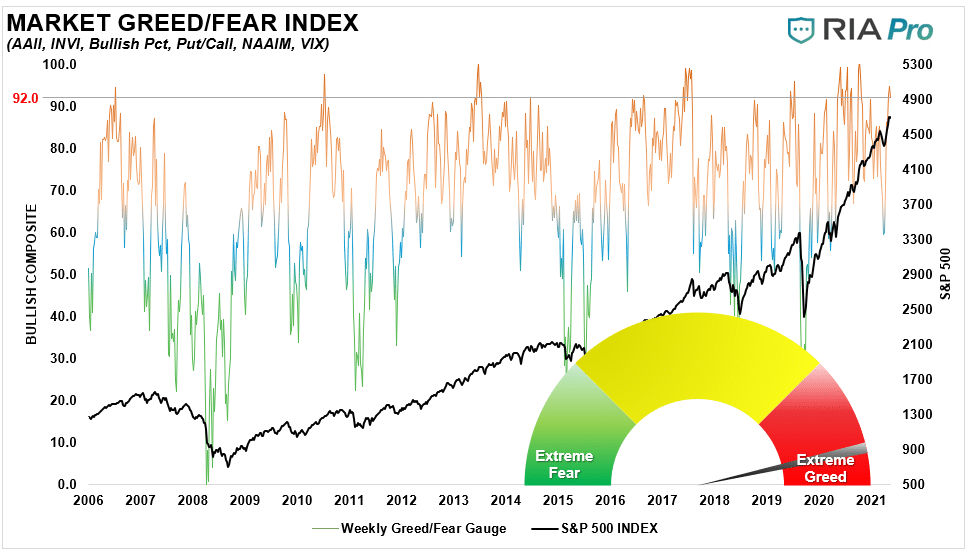
Portfolio Positioning “Fear / Greed” Gauge
Our “Fear/Greed” gauge is how individual and professional investors are “positioning” themselves in the market based on their equity exposure. From a contrarian position, the higher the allocation to equities, to more likely the market is closer to a correction than not. The gauge uses weekly closing data.
NOTE: The Fear/Greed Index measures risk from 0-100. It is a rarity that it reaches levels above 90. The current reading is 92.00 out of a possible 100.
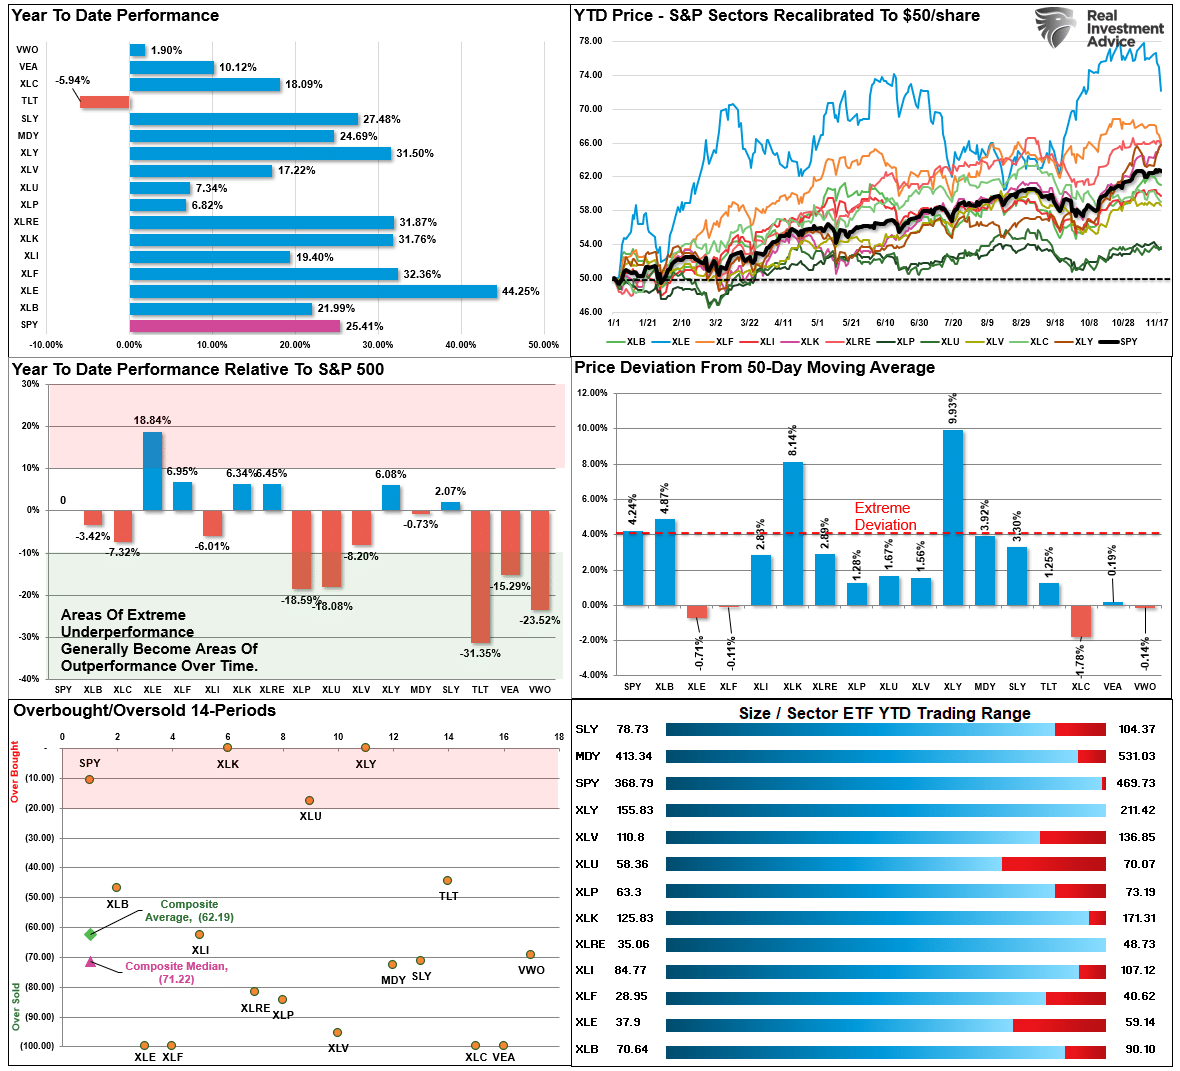
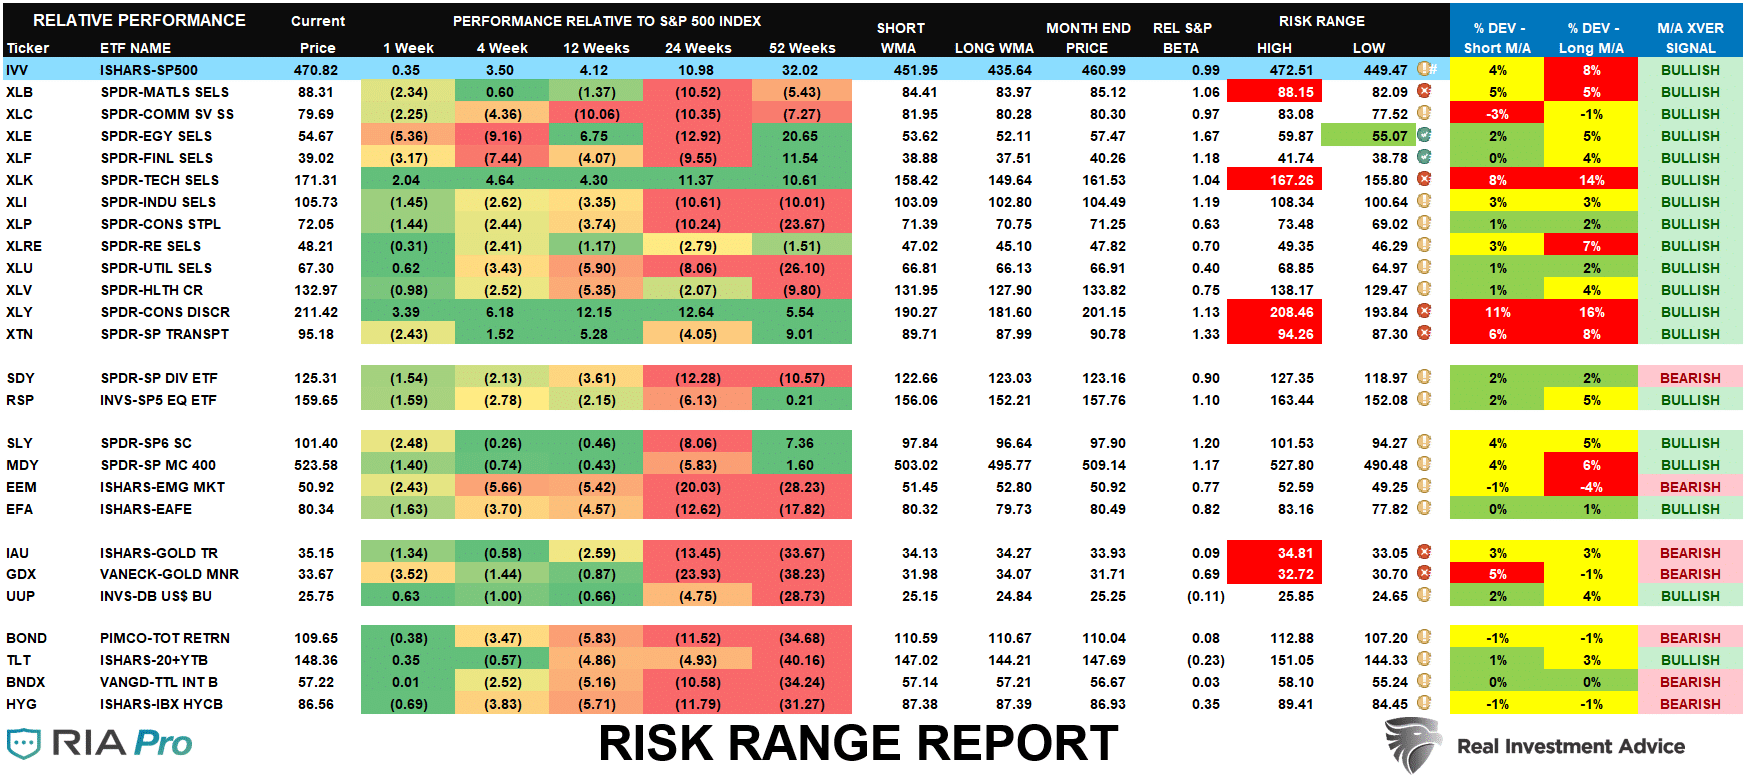
Sector Model Analysis & Risk Ranges
How To Read This Table
- The table compares each sector and market to the S&P 500 index on relative performance.
- “MA XVER” is determined by whether the short-term weekly moving average crosses positively or negatively with the long-term weekly moving average.
- The risk range is a function of the month-end closing price and the “beta” of the sector or market. (Ranges reset on the 1st of each month)
- Table shows the price deviation above and below the weekly moving averages.
Weekly Stock Screens
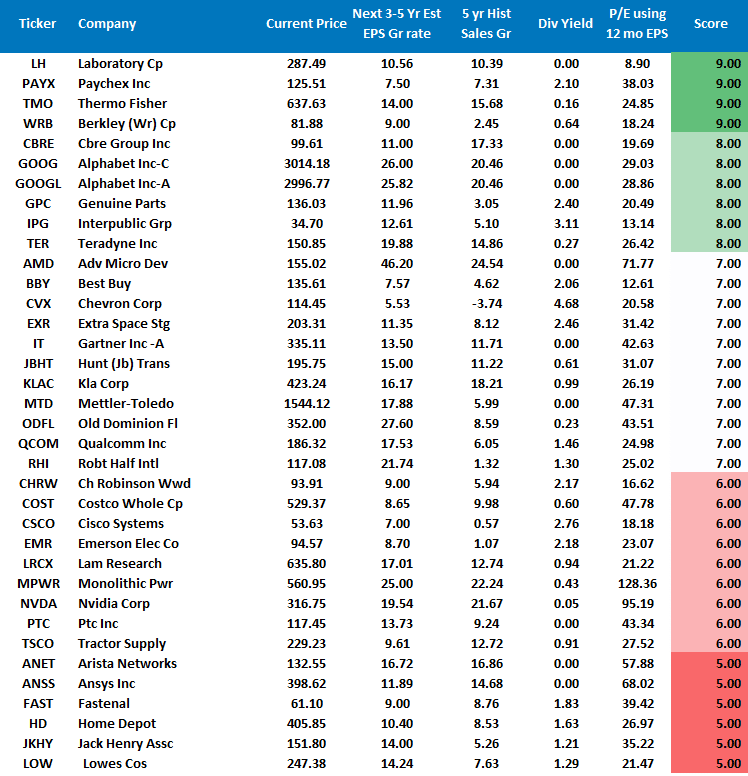
Currently, there are four different stock screens for you to review. The first is S&P 500 based companies with a “Growth” focus, the second is a “Value” screen on the entire universe of stocks, and the last are stocks that are “Technically” strong and breaking above their respective 50-dma.
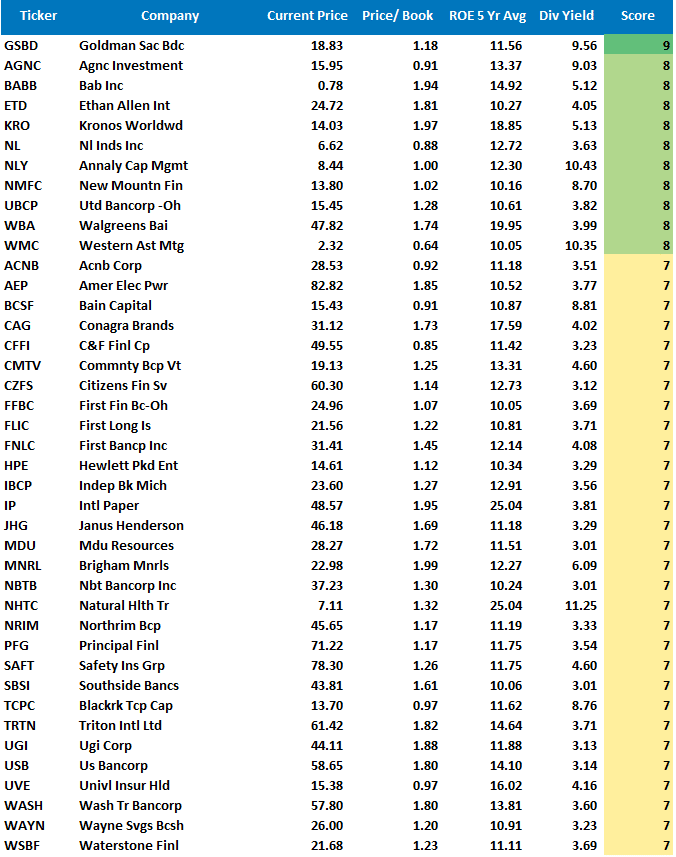
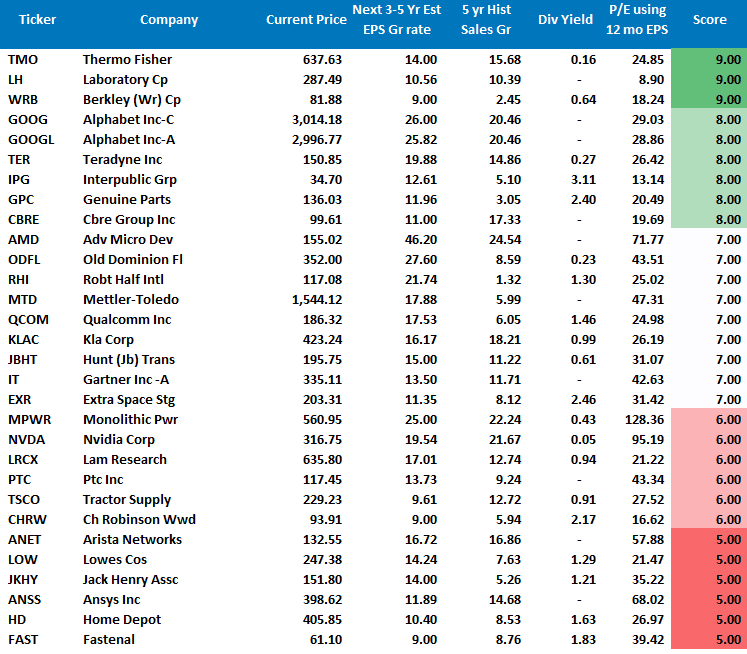
We have provided the yield of each security and a Piotroski Score ranking to help you find fundamentally strong companies on each screen. (For more on the Piotroski Score – read this report.)
S&P 500 Growth Screen
Low P/B, High-Value Score, High Dividend Screen
Fundamental Growth Screen
Aggressive Growth Strategy

Portfolio / Client Update
FOMO is in the air. As noted last week:
“It has been a stellar few weeks in the market. The speculative frenzy quickly returned to the market, and the fear of a correction has “gone with the wind.” However, as noted, the market is now back into more extreme overbought levels. Therefore, we have started taking profits in egregiously overbought positions.”
That process continued this week as we continued to rebalance risk accordingly. As noted in the main body of this week’s missive:
“The bullish bias is strong. We are in the “seasonally strong” period of the year, and the seemingly endless supply of money continues to flood into equities.
Those forces are powerful and trying to fight them has been a futile and costly exercise. Such was a point made this past week as Michael Burry closed out all of his bearish positions. Furthermore, Russell Clark of Russell Clark Investment Management, tagged the world’s most bearish hedge fund, shut down entirely.
We remain focused on the risk of what can, and will, eventually destroy unimaginable amounts of capital. However, we will continue to participate in markets while they are rising.”
Over the next few weeks, there are a couple of risks worth watching. Furthermore, Thanksgiving is traditionally a light trading week, which increases market volatility. However, the first two weeks of December will see the bulk of mutual fund distributions and rebalancing. Such could put downward pressure on the market.
Therefore, any decline will set the market up for the traditional “Santa Claus” rally over the next couple of weeks. Accordingly, we will look to position portfolios while still focusing on our risk controls.
Next year will likely be an entirely different “ball game.”
Portfolio Changes
During the past week, we made minor changes to portfolios. In addition, we post all trades in real-time at RIAPRO.NET.
*** Trading Update – Equity and Sector Models ***
“We previously put on a small volatility hedge in light of the record number of call options outstanding. At that time we said we would close out that hedge when those options expired. This more we sold the entire hedge of VXX at a small loss. Given that next week is Thanksgiving, and trading volumes will be exceptionally light, we are leaving the portfolios with a heavier weighting of cash to offset risk.” – 11/18/21
Equity & ETF Models
- Sell 100% of the Volatility Index (VXX)
“This morning news hit that Amazon (AMZN) would not be accepting Visa (V) credit cards issued in the U.K. That news sent the stock immediately lower this morning violating all of our stop-loss levels. While we still have a small gain in the stock, we are selling the remaining shares in our portfolio. We are looking for a replacement in the space and are evaluating some candidates to add.” – 11/17/21
Equity Model
- Sell 100% of Visa (V)
As always, our short-term concern remains the protection of your portfolio. Accordingly, we remain focused on the differentials between underlying fundamentals and market over-valuations.
Lance Roberts, CIO
Have a great week!


Lance Roberts is a Chief Portfolio Strategist/Economist for RIA Advisors. He is also the host of “The Lance Roberts Podcast” and Chief Editor of the “Real Investment Advice” website and author of “Real Investment Daily” blog and “Real Investment Report“. Follow Lance on Facebook, Twitter, Linked-In and YouTube
Customer Relationship Summary (Form CRS)
Also Read