


It is no secret that Exxon and the energy sector, in general, have been the best place to weather the recent market storm. After hitting an eight-year on Friday, Exxon has risen 45% this year. Exxon is in line with the broad energy ETF XLE, which is up 44% year to date. High energy prices are certainly helping Exxon and others, but it is crucial to provide context for the recent outperformance.
The graph below shows that since 2018, Exxon stock slightly lags the return on the S&P 500, despite the recent surge. Going back further, Exxon is up 68% since 2012, while the S&P 500 is up 220%. While energy may have gotten a little ahead of itself in recent months, there is potentially a lot more relative upside if it continues to catch up to the broader markets on a long-term basis.


What To Watch Today
Economy
• 8:30 a.m. ET: Chicago Fed National Activity Index, April (0.50 expected, 0.44 during the prior month)
Earnings
Pre-market
No notable reports are scheduled for release.
Post-market
- Zoom Video (ZM) to report adjusted earnings of $0.87 on revenue of $1.07 billion
- Advance Auto Parts (AAP) to report adjusted earnings of $3.61 on revenue of $3.38 billion
- Nordson (NDSN) to report adjusted earnings of $2.29 on revenue of $646.90 million
Market Trading Update – Is This A 2008 Redux
The market rally we were hoping for ended abruptly as retail reports showed a recession is coming. However, since the stock market leads the economy, a recession could already be here.
A review of the current market and 2008 is helpful. I am not suggesting a financial crisis is coming, but the market did clearly note a recession was already well in progress.

The head and shoulders topping pattern is quite evident. The break of the rising neckline was the first warning of a recessionary bear market. The subsequent rally to, and failure at, the neckline confirmed the topping process was complete.
We see the same market action in 2022.
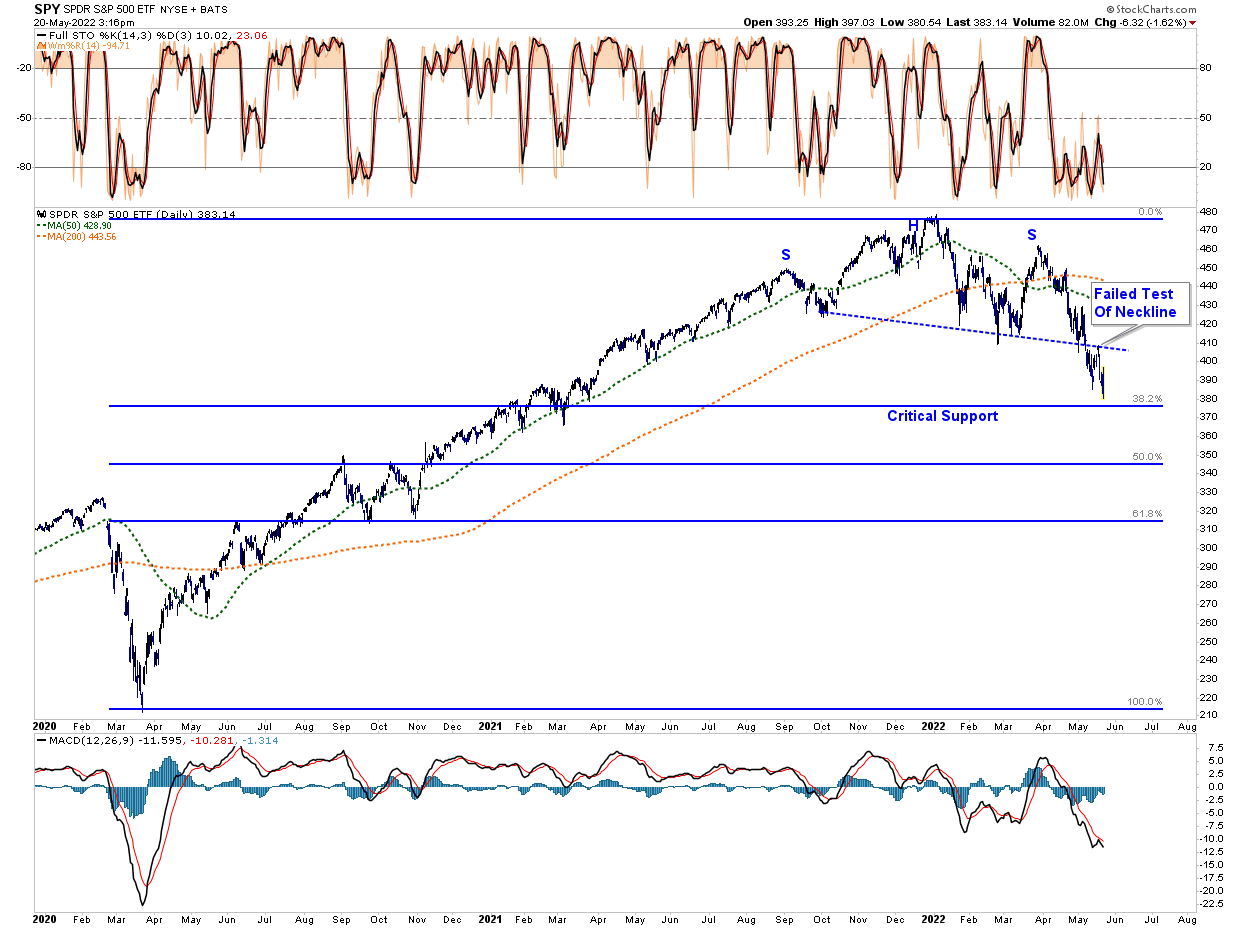
Again, we see the topping process, the clear break of the neckline, and a failed test of the neckline turning it into resistance. While the market is sitting on critical support, any failure will confirm a recession, and a bear market is in process.
Most importantly, bonds are confirming the same. For the last couple of months, bonds remained highly correlated to equities as fears of inflation reigned. That changed as investors started to adopt the reality that a “hard-landing” is probable, and bonds are “working” as a risk-asset hedge.

Given the large short-position against bonds currently, the short-covering in longer-duration bonds is likely only beginning. Those short positions will remain a significant source of “covering” risk instability as it occurs.
QQQ Very Oversold
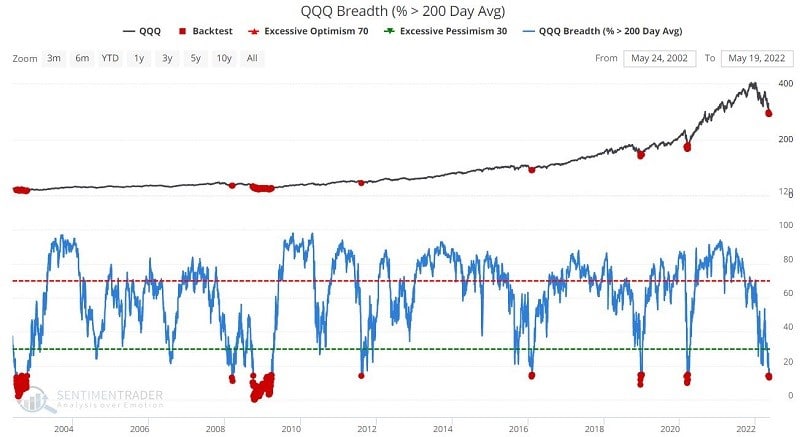
“The chart below displays all days when the % of stocks comprising ticker QQQ (Invesco QQQ Trust) that were above their 200-day moving average was below 15% and the table displays the summary of QQQ performance in the ensuing 12 months.
The good news is that a decline in the % of stocks in the indexes represented above has typically portended significantly higher stock prices in the year ahead. The bad news is that such a signal does NOT constitute an “All Clear” signal. Following a signal, things can – and often do – get notably worse before they get better.” – Sentiment Trader
The Week Ahead
Of importance this week will be the release of the PCE Price index on Friday. This index, the Fed’s preference for gauging inflation, is expected to rise .3% monthly, down from 0.9% last month. A low monthly reading will add evidence to the case that inflation may have peaked. Further evidence will also be found in the University of Michigan Consumer Inflation Expectations, also due on Friday, and the Richmond Fed Manufacturing Index on Tuesday. We warn it is too early to call a turn in inflation rates, but recent data points have been favorable. Economists will closely follow Thursday’s Jobless Claims data for signs that employment is weakening. As we wrote last week, this data point may not be as prescient as it has been due to the shortage of potential employees and, therefore, a reluctance to lay off workers.
The Fed will release the minutes from its last FOMC meeting on Wednesday. The “minutes” provide more description of the previous Fed meeting. Further, they often update the language to reflect more current Fed views. Any hawkish or dovish changes to their outlook will likely significantly affect the markets. As we have seen, there will be numerous Fed speakers this week. Over the last two weeks, there have not been many surprises, nor do we expect any this week.
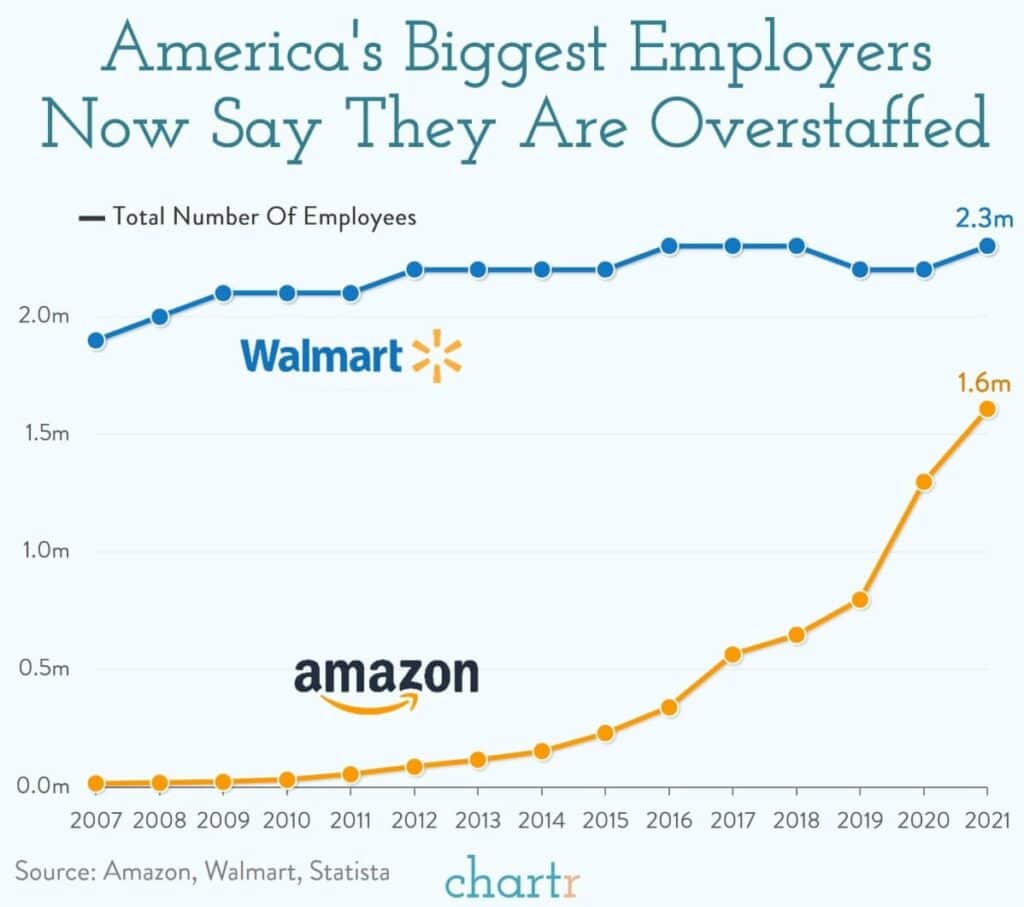
Biggest Employers Say They Are OVER-Staffed
“There has been a lot of commentary in recent months about how tight the labor market is and how hard it’s been for companies to get enough workers. So it was a bit of a shock this week to hear that Walmart and Amazon — America’s biggest private employers — both reported being overstaffed in the first quarter of this year.” – Chartr
That is not a great sign economically speaking.
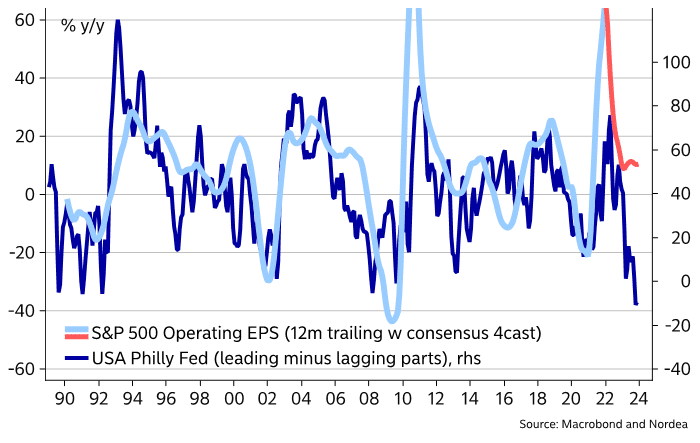
Philly Fed Warns About Earnings
We have recently been writing about weakness in a few regional manufacturing surveys. The graph below shows why we should pay attention to their warnings. It shows there is a strong correlation between the Philadelphia Fed Index and S&P 500 operating earnings with a 12-month lag. Based solely on the correlation, a 20-40% decline in S&P 500 EPS should not be a shock.
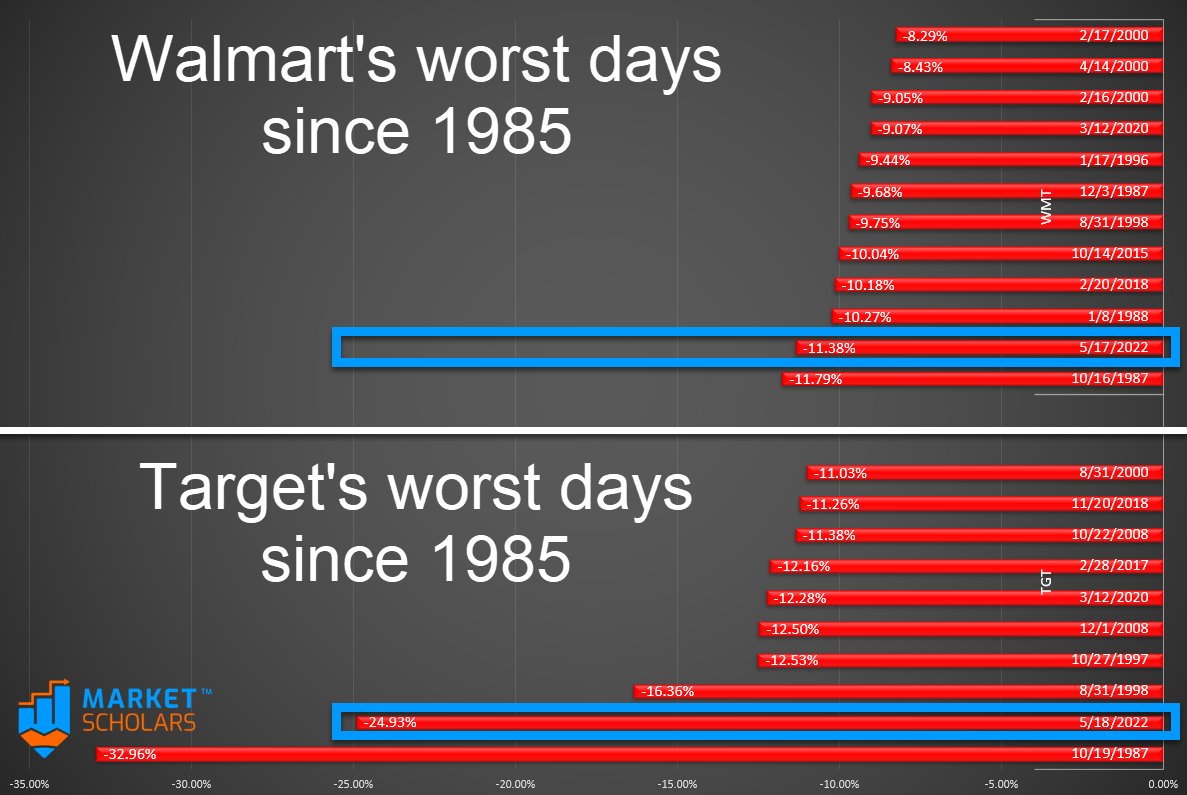
Retailer Bloodbath Continues
Last week, we highlighted Target’s and Walmart’s poor earnings reports. We also elaborated on how inflation hurts profits and changes the mix of products sold. Add Ross Stores to the list. The stock fell 25% on Friday. The news was similar to the other big retailers; higher inventories, declining margins, and poor earnings. To put last week’s declines for Walmart and Target in context, consider the only time the two stocks fell more in one day was in 1987. Combined, the two companies lost over $100 million in market cap this past week.
Digging Deeper Into Consumer Staples
In SimpleVisor’s weekly Five For Friday report, we screen for stocks that meet a particular theme. This week’s report is a little different. It highlights the broad divergence of technical situations within the consumer staples sector. The table below uses technical scores to assess the ratio of the largest staples stocks to each other and to the XLP sector ETF. The discount retailers, Walmart, Target, and Costco, are the most oversold versus the sector and its larger underlying companies. In the article, we shared the following warning about Clorox, Kellog, and Coca-Cola, which are well overbought versus the discount retailers:
“As household names, they benefit from incremental pricing power that the firms above lack and can better pass on rising costs to protect margins. While that has helped them thus far, the problems the retailers are having may spread to their suppliers.“

Please subscribe to the daily commentary to receive these updates every morning before the opening bell.
If you found this blog useful, please send it to someone else, share it on social media, or contact us to set up a meeting.
Also Read


