


Should Stock Investors Beware of the Ides of March?
The “Ides of March” is a notorious day in the western world. March 15th is traditionally believed to be the day that Julius Caesar was assassinated by Brutus in 44 B.C. “Beware the Ides of March” has become a phrase imprinted in western consciousness.

Source: Wikipedia
In the earliest calendars, the Ides of March was the first full moon of the new year. At the one-year cycle of pandemic shutdowns, should investors be wary of another sell-off similar to March 2020?

Quadruple Witching
Adding to potential risks this month is the quadruple witching expiration on March 19th. The third Friday in March, June, September, and December is a critical option expiration date. This is when stock options, index options, and futures options all expire. Investors should take note of the fact the two prior major sell-offs in equities climaxed the week of these quarterly expirations: in December 2018 and in March 2020.
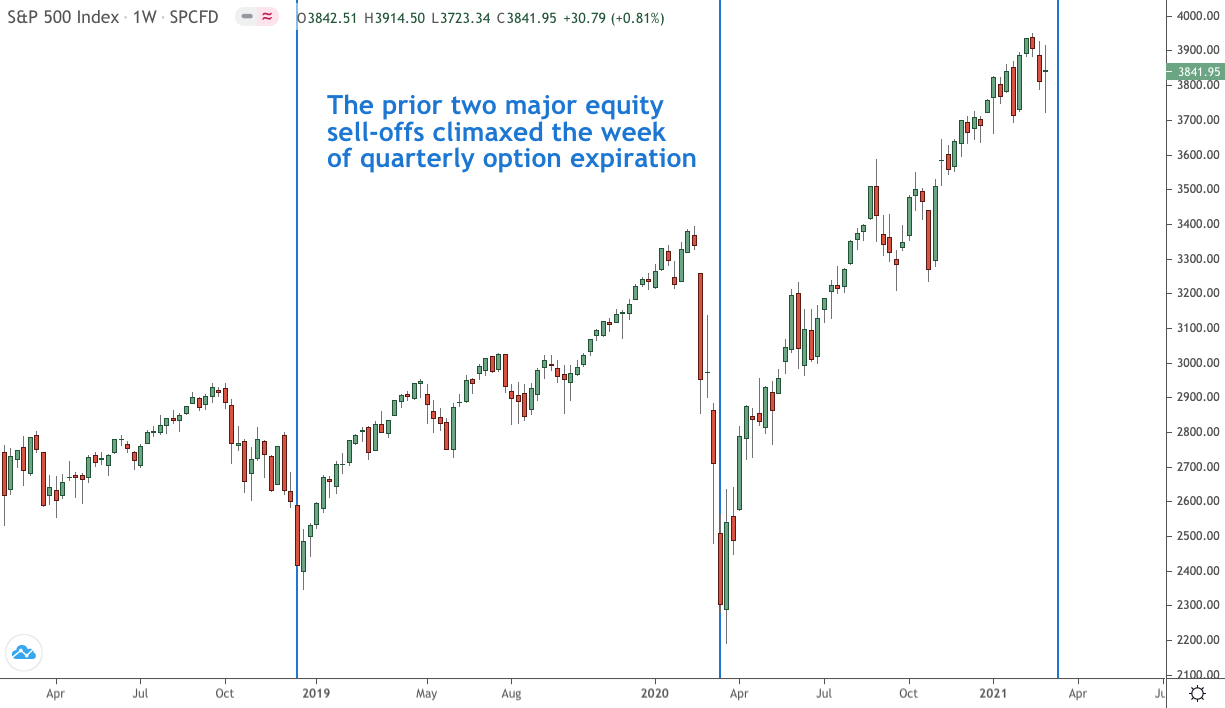
Quarterly option expiration in the S&P 500 and other stock indices carry considerable option open interest. This, in turn, fuels gamma risk during the quarterly time periods. Options dealers who sell options can be forced to sell the stock indices when prices decline. These actions can create a vicious circle of selling, particularly in and around the options expiration date.
The downward pressure in stocks over the last three weeks should give investors pause for thought. It may be wise to consider a tactical approach over the next several weeks.

The Gamma Flip as a Risk Management Tool
One tool for managing equity risk this month is the understanding and application of the Gamma Flip in the S&P 500 (SPX).
Many market analysts have noted that daily volatility in the S&P 500 will change when the value of the SPX moves from one gamma regime to another. Some analysts call this level the “gamma flip.” The scatterplot below shows how price volatility (on the y-axis) tends to be lower when the value of SPX rises higher above the Gamma Neutral level. When the value of the S&P is lower than Gamma Neutral (left side of chart), volatility is higher.
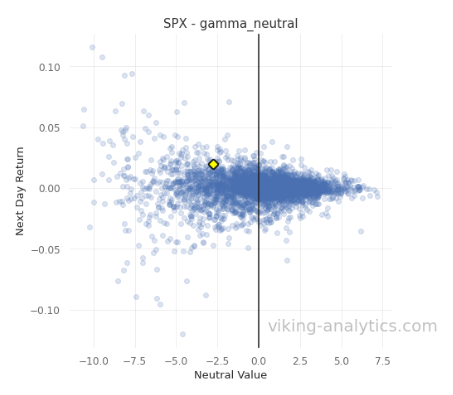
Since market volatility is known to be higher when the value of SPX is below the Gamma Flip level, one approach would be to reduce equity exposure as long as stocks remain below this level. At Friday’s close, SPX (3,842) was below the Gamma Flip level (near 3,865). This indicates a higher expected risk for the days ahead.
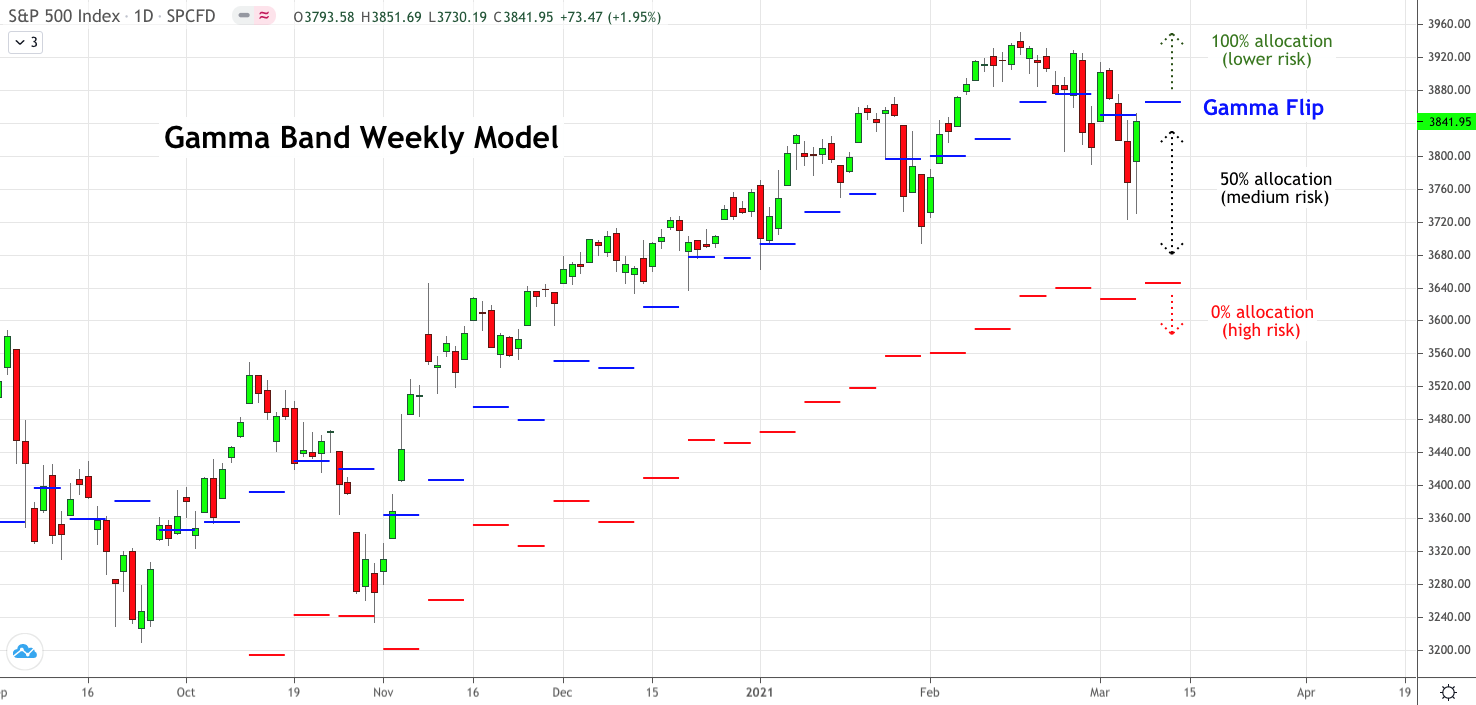
If the market closes on a daily basis below the lower gamma level (currently near 3,645), this model will reduce the SPX allocation to zero. If the market over-takes the Gamma Flip level (3,865) on a closing daily basis, this tool would return to 100% exposure.
For investors conditioned to “buy low and sell high,” it might seem counter-intuitive to increase allocations when the market rises. However, this approach has shown to increase risk-adjusted returns by 70% in the back-test. A quick video introduction of what we call the “Gamma Band” model can be seen by following this link.

A Bullish Regime
While there is potential for a gamma-fueled draw-down in March 2021 and beyond, another of our indicators suggests a pull-back will be temporary if it does occur. The overall options market suggests that the market is still in a bullish regime.
Recently, “hot money” investors have purchased more put protection than the “smart money” investors. In the past, when the hot money appetite for protection exceeds the smart money appetite, stocks continued to rise.
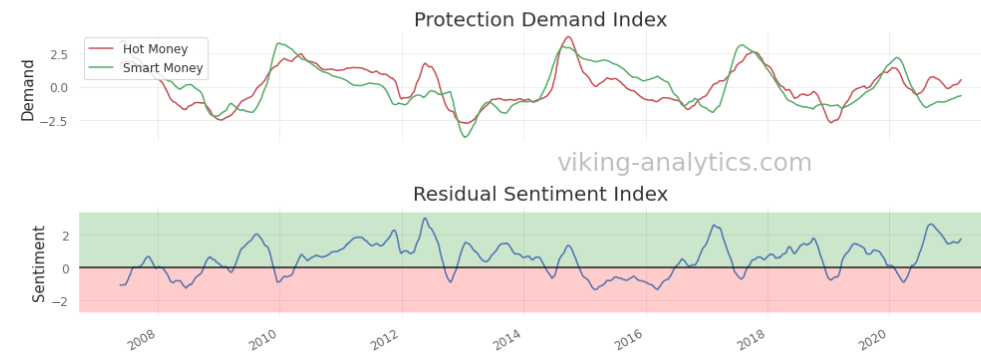
To interpret the tool above, when the Residual Sentiment is in the green zone, our model maintains a bullish regime (such as now). When the Residual Sentiment is in the red zone, our view is that that market is in a bearish regime. When the market is in the red zone, the overall return for SPX since 2007 is negative.
Summary Thoughts
The March quarterly options expiration carries a lot of gamma risk and continued selling pressure could result in forced selling by options dealers which could lead to further selling. As long as the value of SPX remains below Gamma Neutral, the market could experience big swings in value, up and down. Our Gamma Band model suggests that risk could begin to accelerate in the area of 3,645, if the market continues lower.
If the market overtakes the Gamma Neutral value, then risk could begin to diminish, and the market could begin to reach back towards new highs.
If the market does indeed experience a large correction in March/April, then we will be looking for tactical signals for a good point of re-entry, as long as we remain in a bullish regime.
Beware of the Ides of March.

Disclaimer and Notes
This is for informational purposes only and is not trading advice. The information contained in this article is subject to our full disclaimer on our website.
The Gamma Band and the Smart Money indicators are two of a few signals that we publish in our daily SPX Report. A free sample of the SPX report can be downloaded from this link. Please visit our website to learn more about our daily reports and price signals.
Author
Erik Lytikainen, the founder of Viking Analytics, has over twenty-five years of experience as a financial analyst, entrepreneur, business developer, and commodity trader. Erik holds an MBA from the University of Maryland and a BS in Mechanical Engineering from Virginia Tech.

Erik Lytikainen, the founder of Viking Analytics, has over twenty five years of experience as a financial analyst, entrepreneur business developer and commodity trader. Erik holds an MBA from the University of Maryland and a BS in Mechanical Engineering from Virginia Tech. You can learn more about his work on his website: www.viking-analytics.com.
Also Read


