


Eric Hickman discusses the recent signal to buy 30-year bonds.
A technical indicator with a reliable history is signaling that 30-year Treasury yields will soon decline.
A relative strength index (RSI) can be measured for any price series and represents how much and frequency gains are occurring versus losses. The index is used as a contrary or turning-point indicator. After periods of strong, persistent selling, buying is expected and vice versa.
It isn’t a complicated calculation. The RSI takes the average price change of days with gains compared to the average price change of days with losses over the last x days. This is converted into an oscillator that can take any position between 0 and 100. When prices (or yields) are rising fast and persistently, the oscillator will approach 100; when selling occurs with lower prices, it will approach 0. The oscillator spends most of its time in the middle, say between 30 and 70. Extreme readings (close to 0 or 100) happen rarely. We can study these extremes historically to see how useful the index is at identifying major turning points in markets.

The RSI On The 30-year U.S. Treasury Yield
For this analysis, I looked at the RSI on 30-year U.S. Treasury yields measured with a 14-day average (the x in the description above). This is the longest and most conservative daily average generally used. I looked at historical times where the RSI equaled or was greater than it was at the close of Wednesday, 2/24/2021, at 78.
A reading of 78 (or more) is rare, happening in just seven periods going back to 2000, about once every three years. You can see them in the chart below. Focus on the high extremes that rise to or above the blue threshold line of 78.

We can translate these points to the 30-year U.S. Treasury yield. Look where the blue vertical lines (RSI over 78) intersect the gray line (30-year UST yields). The blue arrows show that yields fell (prices rose) after these buy signals, suggesting a buy signal now.


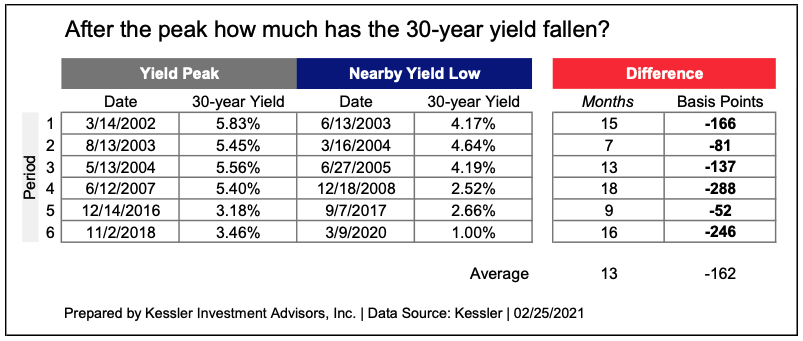
But those signals didn’t happen at the yield peaks; they occurred before. The question is how far before and how much more did yields rise after the signal? In other words, assuming this signal triggered on Wednesday, 2/24/2021, how long will it be until yields peak, and how much could yields rise in the meantime?

A Good Signal To Buy 30-Year Bonds.
The table below summarizes the answers to those questions. The signal triggered between 0 and 35 days before and between 0 and 33 basis points (0.33%) below the peak in yields. This averages 14 days before and 12 basis points below the peak, which suggests a yield peak on 03/10/2021 at 2.36%. This is much too specific a prediction for markets, but it gives an idea of where we might be in this 30-year yield backup.
It looks to be about over.

The yield movements down from the peaks predicted by the RSI have been significant; they led to significant gains in long-term U.S. Treasury bonds.
One should never rely on technical indicators alone. But this analysis, combined with an overly rosy expectation of COVID-19 disappearing and the economics beyond that, suggests an opportunity in U.S. Treasury bonds

Eric Hickman is president of Kessler Investment Advisors, Inc., an advisory firm located in Denver, Colorado, specializing in U.S. Treasury bonds.


Lance Roberts is a Chief Portfolio Strategist/Economist for RIA Advisors. He is also the host of “The Lance Roberts Podcast” and Chief Editor of the “Real Investment Advice” website and author of “Real Investment Daily” blog and “Real Investment Report“. Follow Lance on Facebook, Twitter, Linked-In and YouTube
Customer Relationship Summary (Form CRS)
Also Read


