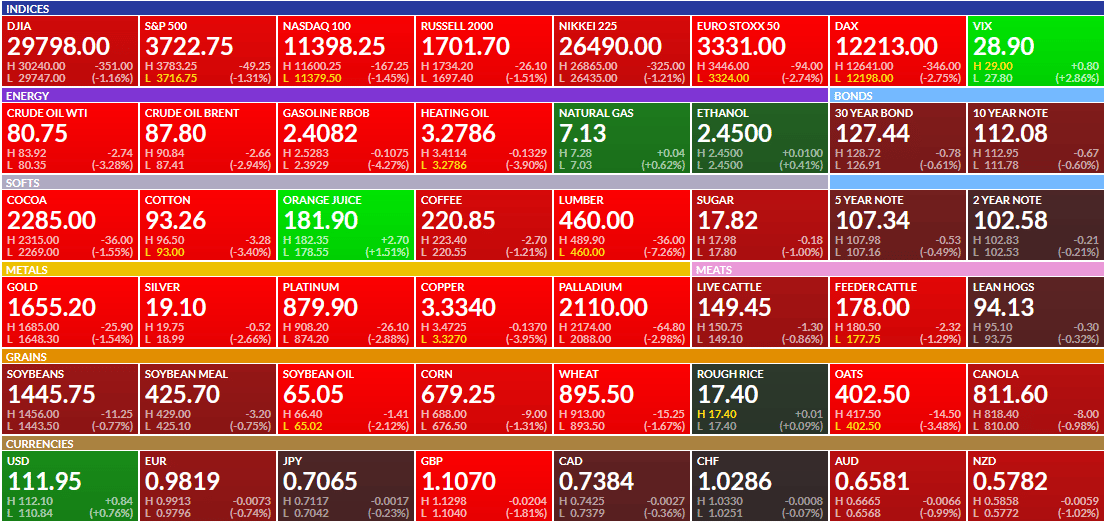
Why are stocks, bonds, and commodities tumbling? To answer, one only needs to look at one price. The recent strength of the U.S. dollar is pushing most other risk assets lower. For instance, the table below shows the markets that investors woke up to on Friday morning. The U.S. dollar index was higher by almost one dollar, and virtually every asset was red. Dollar strength is occurring in part because the Fed is much more aggressive than all other nations about fighting inflation. Importantly, dollar strength is feeding on itself. As the dollar rises, bond yields are following higher. The result is that U.S. bonds attract foreign money, which must sell their current currency to buy dollars.
Further fueling U.S. dollar strength, many foreign entities borrow in dollars. As dollar appreciation occurs, their ability to repay in dollars becomes more costly, requiring more dollars to satisfy interest and principal requirements. It’s also worth adding rapid dollar appreciation can lead to global financial instability and weaker earnings for U.S. companies. The dollar spiral higher may continue. However, the world’s central banks closely monitor the U.S. dollar and will likely react powerfully. Such may lead to a robust risk-on rally, but there is no telling how much longer the U.S. dollar will appreciate first.

What To Watch Today
Economy
- 8:30 a.m. ET: Chicago Fed National Activity Index, August (0.27 prior)
- 10:30 a.m. ET: Dallas Fed Manufacturing Activity Index, September (-12.0 expected, -12.9 prior)
Earnings
- No notable earnings releases today
Market Trading Update
It was a tough week for equities as the Fed hiked 75bps and signaled that “no pivot” in policy is coming. Such disappointed the markets in desperate need of some “encouraging news,” but none was to be had. Furthermore, the Fed slashed economic growth drastically, upped their unemployment projections, and kept inflation expectations elevated through 2023. The dollar strength is also exacerbating issues.
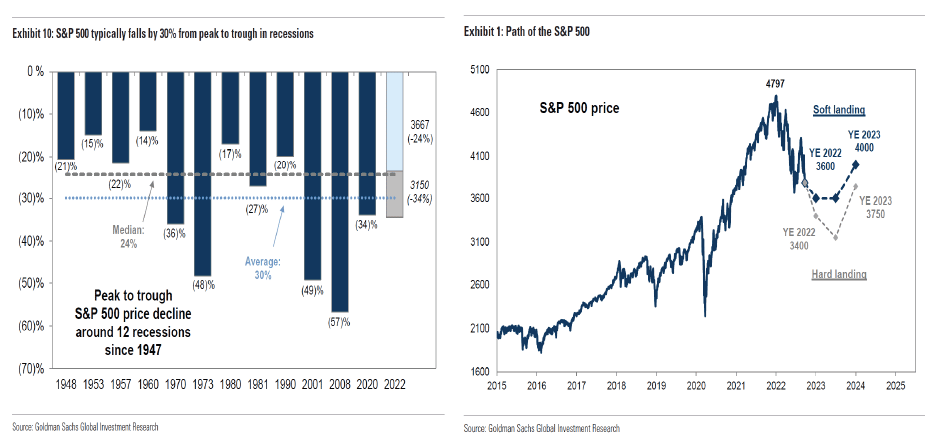
Markets broke through support and tested this year’s lows on Friday as selling was broad-based. The market is now figuring out the rising risk of a policy mistake. On Friday, Goldman Sachs slashed their year-end price targets for the S&P 500 index. The “hard landing” scenario was most important.
In a recession, we forecast earnings will fall and the yield gap will widen, pushing the index to a trough of 3150. Our economists assign a 35% probability of recession in the next 12 months and note that any recession would likely be mild given the lack of major financial imbalances in the economy. As we previously outlined, in the event of a moderate recession, our top-down model indicates EPS would fall by 11% to $200.
For context, a 34% peak-to-trough decline in the S&P 500 index during a recession would only be slightly worse than the historical average of 30%. We see two risks that would create a more dramatic sell-off in equities during a recession. First, if inflation concerns were to limit the degree of monetary or fiscal policy support and interest rates did not fall, it could lead to even lower valuations or even larger economic and earnings growth declines than we model. Second, concentrated sector weakness, such as Information Technology in 2001 and Financials in 2008, could lead to an even sharper earnings and price decline.
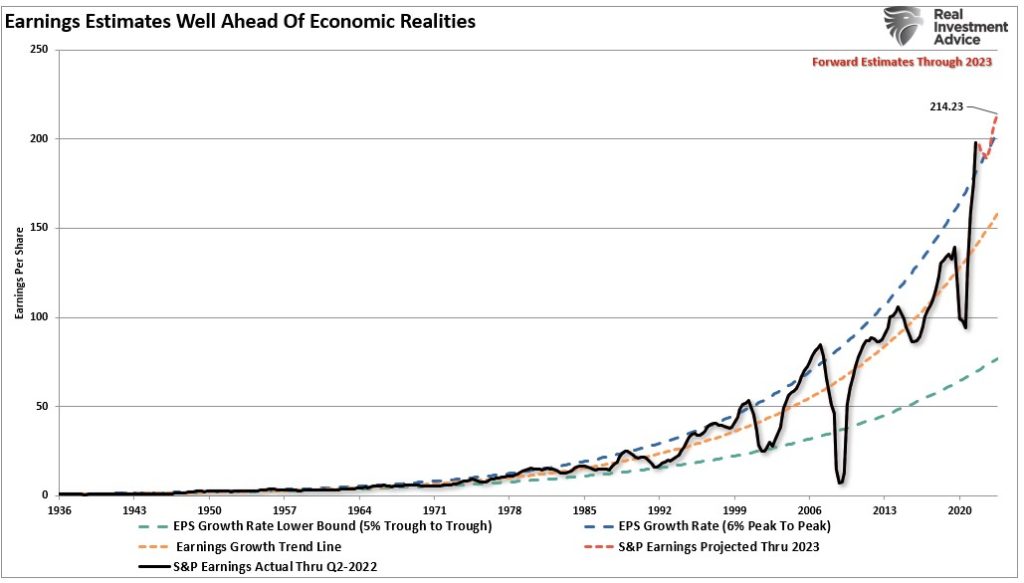
While Goldman is finally coming to grips with economic and fundamental realities, its expectations for only modest earnings and margin decline are still exuberant. As we discussed recently, earnings will likely revert to below $200/share just to reach the median long-term growth trend.
“More importantly, despite the recent downward revisions, the current estimates still exceed the historical 6% exponential growth trend, which contained earnings growth since 1950, by one of the most significant deviations ever.“
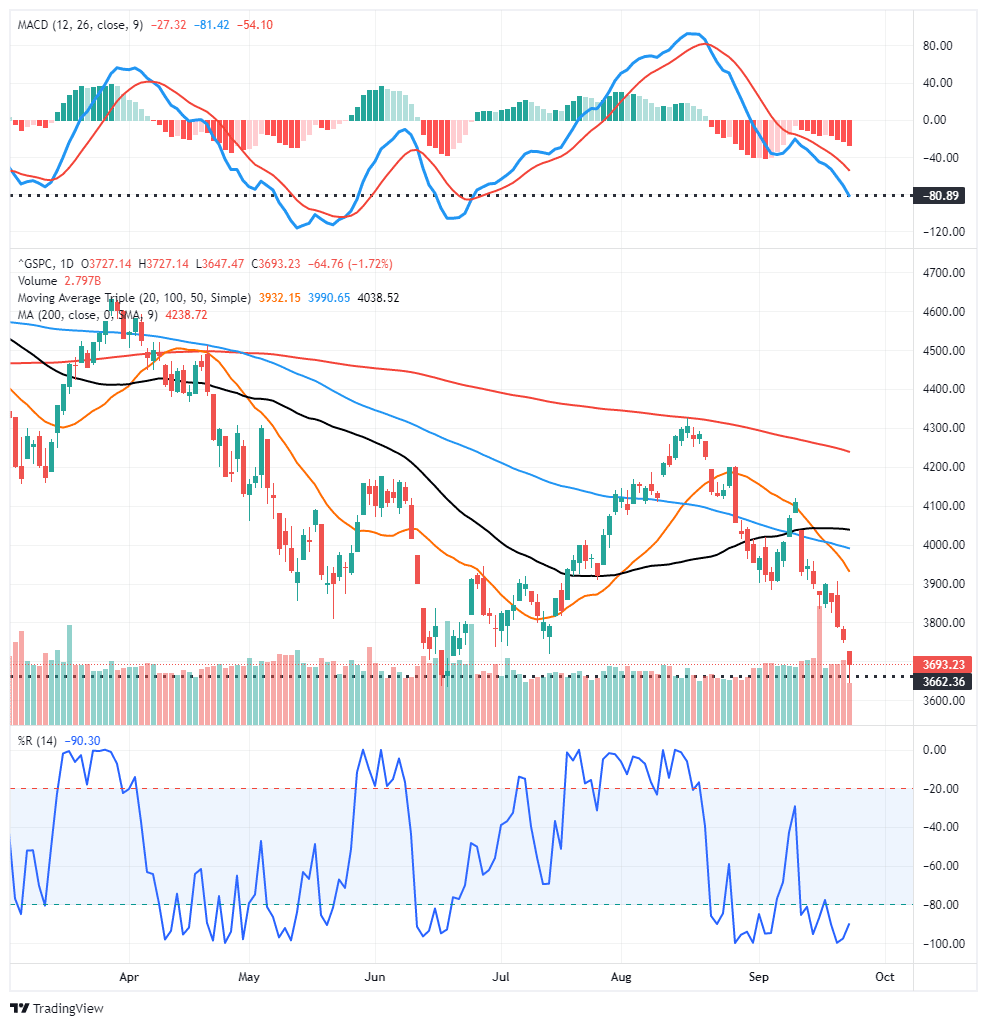
Such leaves the markets in a very tenuous position. However, in the short-term, markets are testing this year’s lows and are sufficiently oversold to provide a relief rally. However, there is little to get excited about until the Fed stops hiking rates aggressively and reducing its balance sheet. We will cut equity exposure levels on the next rally and raise cash levels further. Keep a watch on the MACD signal (top of the chart), as it will provide the best guidance for a sellable rally near term. There is a lot of congestion at the 3900-4000 level, which will provide sufficient resistance to cap a reflexive rally. Those levels provide a reasonable “sell” target for now.
The Week Ahead
A decent amount of economic data is spread throughout the week, but Friday will likely be the most important day. The PCE price index is the Fed’s preferred inflation gauge. Analysts expect it to show a 0.1% and a year-over-year inflation rate of 6.2%. The more critical core index should rise from 4.6% to 4.7%. Investors will also focus on other inflation indicators this week, such as Chicago PMI, University of Michigan inflation expectations, and the Dallas, Richmond, and Chicago Fed manufacturing indexes.
As we have noted, over a third of CPI is from the housing sector. The Case-Shiller Home Price index will come out tomorrow. Expectations are for a 0.2% increase but a decline in the annual index from 16.2% to 15%.
This Friday will be the last trading day for the quarter. Therefore we may see window dressing trades add to the recent spate of equity volatility.
Is The Fed Trapped?
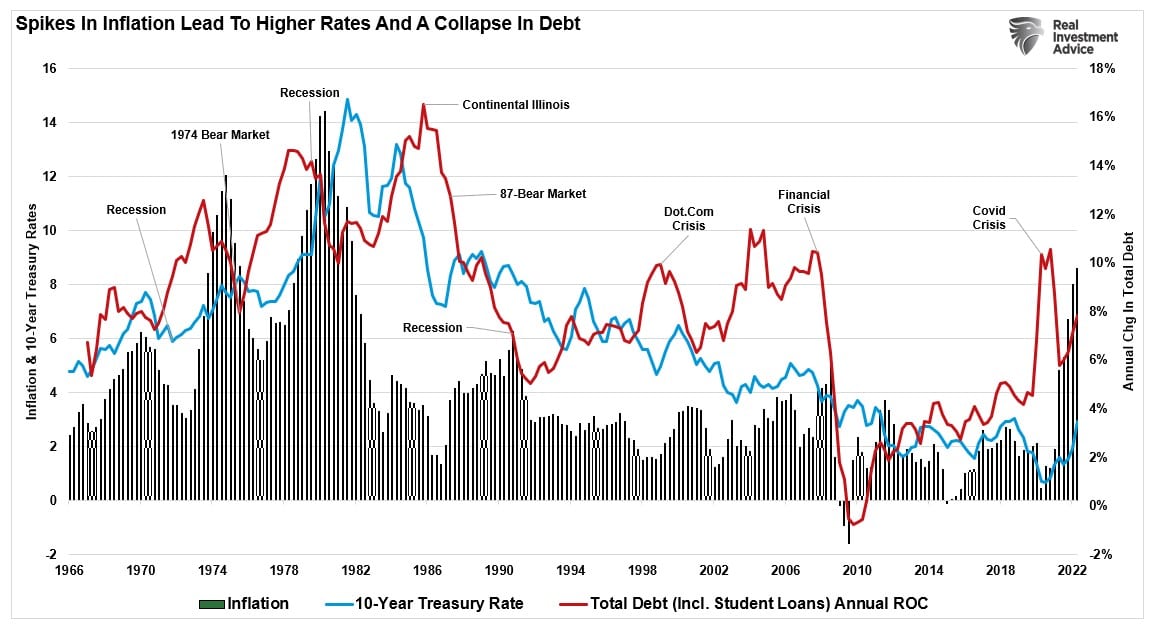
Over the last few months, we have discussed how this instance of fighting inflation is far different from that of the 70s and 80s. This time, the Fed must deal with excessive leverage in the public and private sectors. As such, raising interest rates is a much more powerful tool, but it also presents much more economic and financial damage if rates rise too much. Below are a couple of quotes from articles Michael and Lance put out last week on the topic.
Restrictive policy, including double-digit interest rates, quelled Volcker’s high inflation regime. This time that anecdote is not feasible. Unlike the 70s and early 80s, when debt levels were low and equity valuations cheap, today’s economic and financial environments are the opposite.
Today’s economy relies heavily on debt for consumption and to roll over maturing debt and avoid bankruptcy. High-interest rates will be exponentially more damaging than they were forty years ago. – Tail Risk and Persistent Inflation – Michael Lebowitz
The reason that slowing economic growth, and killing inflation, is critical for the Fed is due to the massive amount of leverage in the economy. If inflation remains high, interest rates will adjust, triggering a debt crisis as servicing requirements increase and defaults rise. Historically, such events led to a recession at best and a financial crisis at worst. – Debt & Why The Fed is Trapped – Lance Roberts
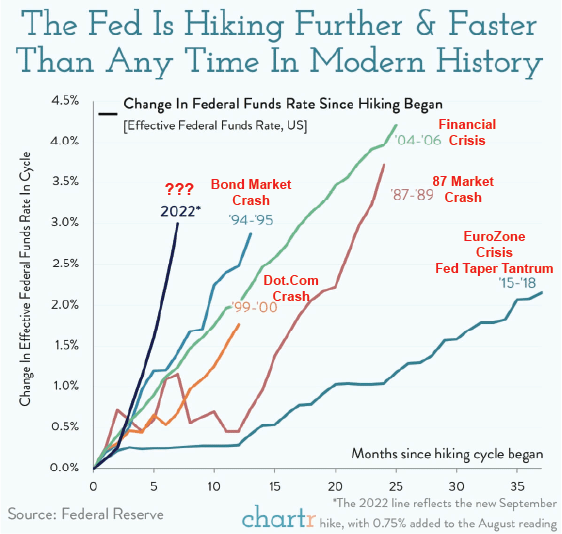
The Fed Is Hiking At A Record Pace
“This week, the Federal Reserve signed off on its third consecutive three-quarter point rate hike, lifting the benchmark federal funds rate to a range of 3-3.25%.
That’s an unprecedented pace of rate rises in modern history, signaling the Fed’s strong resolve to get double-digit inflation under control. No other hiking cycle has started this steeply since the Fed started targeting the Effective Funds Rate in the 1980s.
Unlike when it first appeared on your lockdown dating profile, the Fed’s new-found fondness for hiking looks here to stay. Officials project that rate rises will continue into 2023, with estimates that the target rate will hit around 4.6% by the end of next year. Equity investors were surprised again by this week’s news, with US stocks down another 3% since Monday.” – Chartr
Annotations to chart added by Real Investment Advice
Fannie Mae’s Housing and Mortgage Outlook
The table below shows Fannie Mae’s latest monthly update and forecast on the housing market and mortgage rates. Since its last update a month ago, there have been significant revisions. For instance, they revised lower home sales. In August, Total home sales were expected to fall by 16.2% and 10.3% this year and next year. In just one month, they revised both figures lower by 1% and 2.5%, respectively. The downgrade is likely in large part due to their outlook on mortgage rates. Fannie Mae expects mortgage rates to average 5% this year and 5.6% in 2023. Current mortgage rates are near 6.50%.

Tweet of the Day
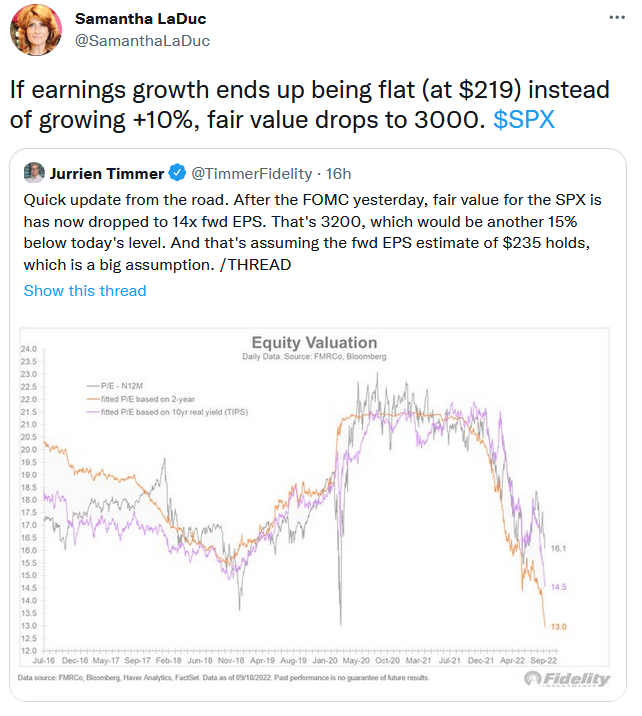
Please subscribe to the daily commentary to receive these updates every morning before the opening bell.
If you found this blog useful, please send it to someone else, share it on social media, or contact us to set up a meeting.
Also Read