


Disinflation, and ultimately deflation, is a more significant threat than inflation over the next two years.
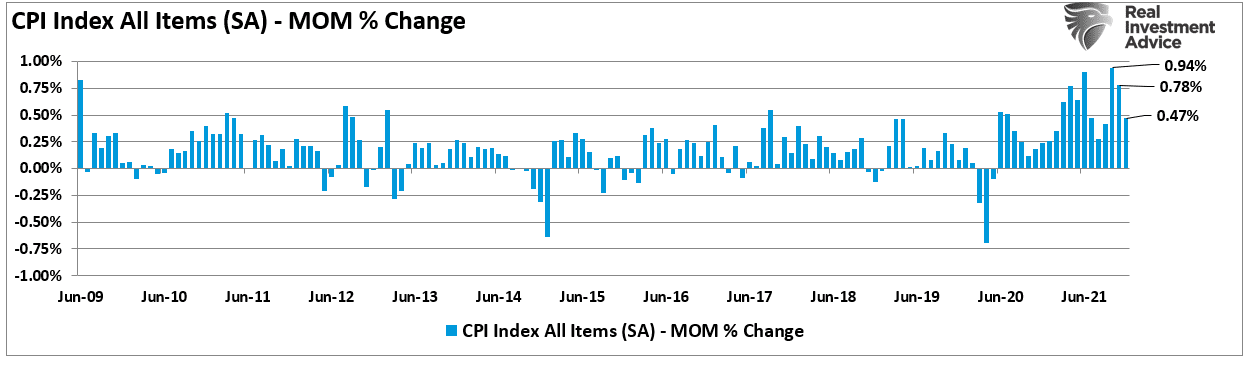
However, in the short term, the spike in inflationary measures is dominating headlines, pushing the Fed to act and squeezing consumers. At more than 7% annualized, such is the highest inflationary rate seen since the 1980s.

However, if the prices of goods and services remain over the next year, the disinflation will push CPI to zero. More importantly, we already see the month-over-month inflation rates declining towards more normal levels seen since 2009.
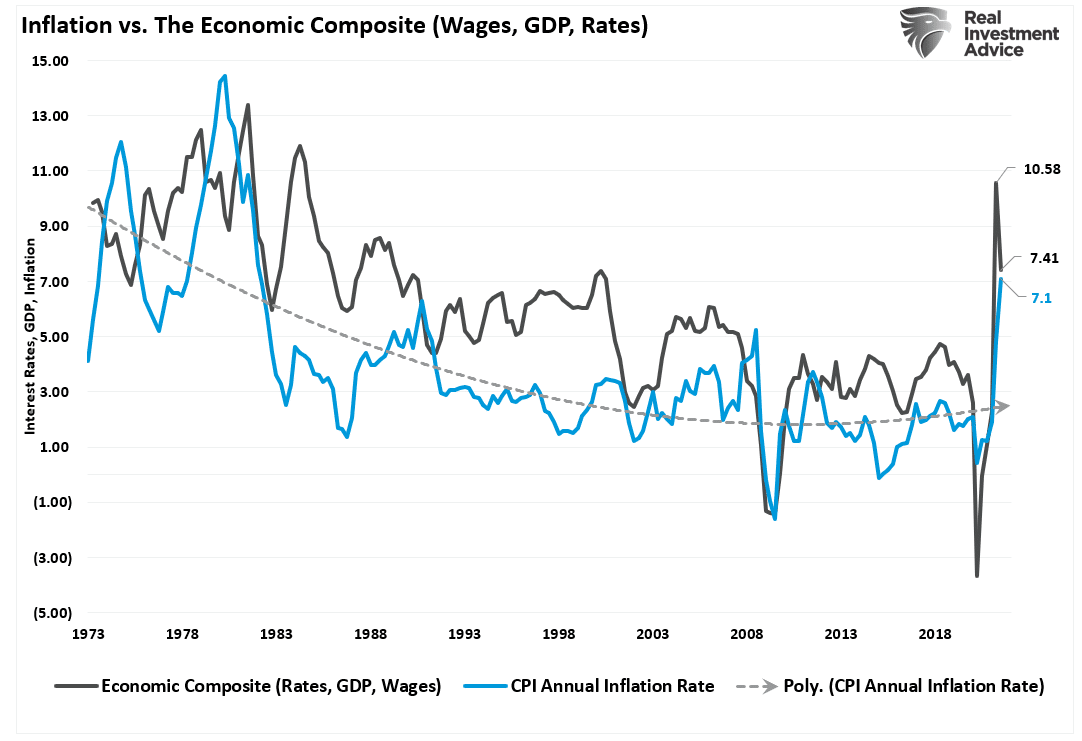
Given the correlation between interest rates, inflation, and economic growth, there are several reasons to expect disinflation in the months ahead. The first is that the composite economic index (Wages, GDP, and Rates) peaked in Q3 of 2021.

Artificial Inflation Is Unsustainable
Another issue with the “persistent inflation” theory is the artificial nature of the inflationary surge. Such was a point we discussed in “Is Hyperinflation A Threat?”
“The measure of money in the system, known as M2, is skyrocketing, which certainly supports that concern. Now, with the Biden administration adding another $1.9 trillion into the economy, those concerns have risen.”
Furthermore, in a previous Bloomberg interview, Larry Summers stated:
“There is a chance that macroeconomic stimulus on a scale closer to World War II levels will set off inflationary pressures of a kind not seen in a generation. I worry that containing an inflationary outbreak without triggering a recession could be even more difficult now than in the past.”
The chart below suggests those points are correct. Given it takes about 9-months for increases in money supply to hit the economy, we see the inflationary spike. However, as shown, given that fiscal policy is absent, the extended benefits have expired, and the money now spent, disinflation will asset itself.
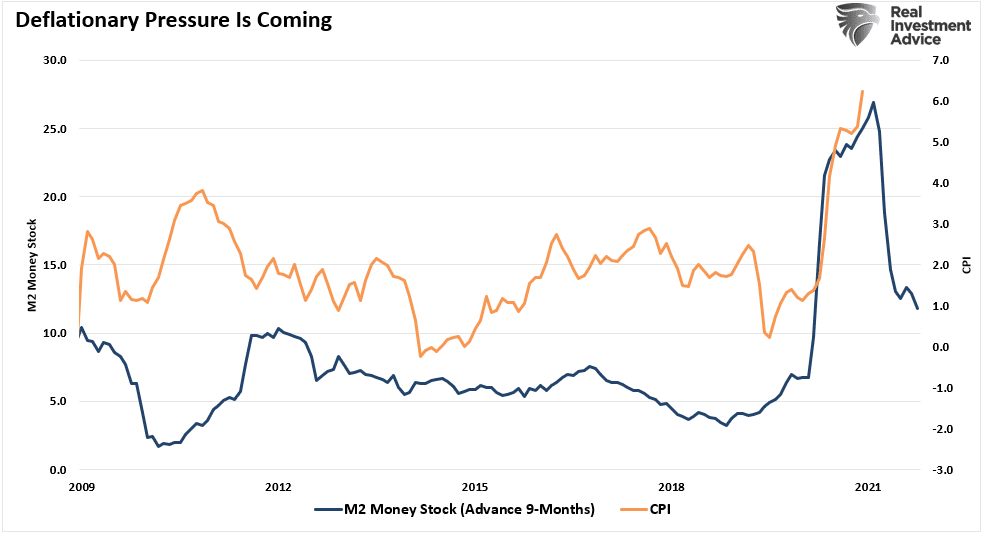
The sharp decline in money supply suggests deflationary impulses in the economy will become visible around the middle of 2022. Given that the “demand push” swamped output in a supply-strained economy due to the shutdown, it was not surprising to see shortages and surging inflation.
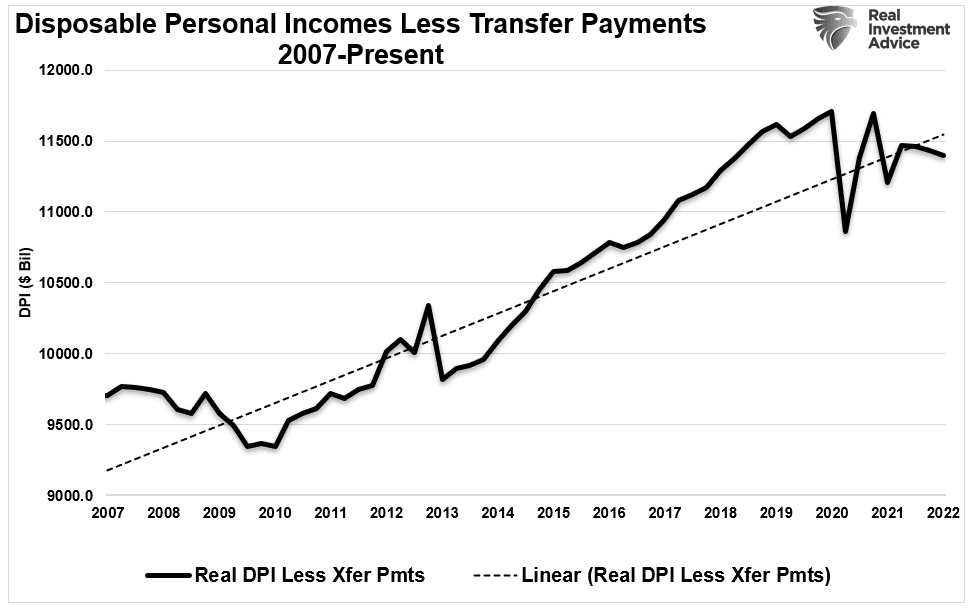
However, now companies are ramping up production when consumer savings, and real disposable incomes, are falling back to norms. When supply outstrips demand, which will happen, disinflation will become a more significant problem for the economy and the Federal Reserve.
However, there is an even more significant headwind to inflation than money supply changes.

Debt Is Deflationary
Over the coming decades, the massive surge in unproductive debt will increase deflationary pressures and slower economic growth.
These issues are not new. But have been plaguing economic growth for the last 40-years. Moreover, given the baby-boomer generation has reached retirement age, they will leave the workforce at an increasing rate, drawing on their accumulated financial assets. As a result, the debts and deficits will continue to detract from rather than contribute to economic growth.
As shown, the surge in debt and deficits coincides with a peak in the 10-year average economic growth rate.
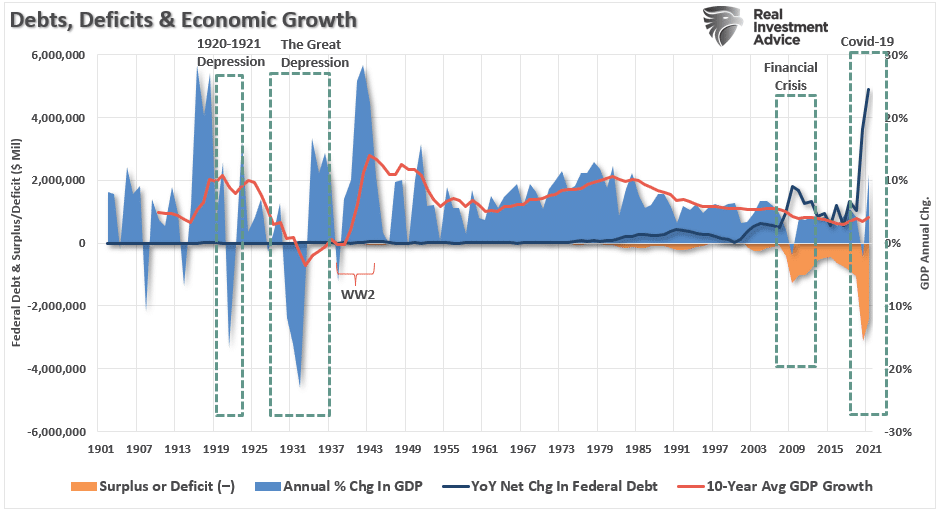
The decline in economic prosperity adds deflationary pressures on the economy. Such requires continued government deficit spending to sustain the demands on the welfare system.
The negative impact on the economy is evident. There is a significant negative correlation between the size of the government and economic growth. Instead, debt is the problem, not the solution.
Lacy Hunt agrees with our assessment.
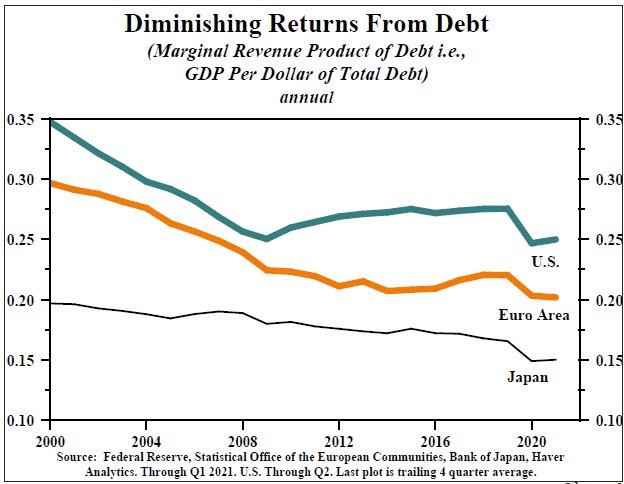
Lacy Hunt On The Diminishing Returns Of Debt
“Excessive indebtedness acts as a tax on future growth. It is also consistent with Hyman Minsky’s concept of ‘Ponzi finance.‘ Such means the size and type of debt being added cannot generate a cash flow to repay principal and interest. While the debt has not resulted in the sustained instability in financial markets envisioned by Minsky, the slow reduction in economic growth and the standard of living is more insidious.
Swedish econometricians Andreas Bergh and Magnus Henrekson, writing in the prestigious Journal of Economic Surveys in 2011, substantiate that there is a ‘significant negative correlation’ between the size of government and economic growth. Specifically, ‘an increase in government size by 10 percentage points is associated with a 0.5% to 1% lower annual growth rate.‘ This suggests that if spending increases, the government expenditure multiplier will become more negative over time.
Second, Ethan Ilsetzki (London School of Economics), Enrique Mendoza (University of Pennsylvania), and Carlos Vegh (University of Maryland) in a study published by peer-reviewed the Journal of Monetary Economics in 2013 concluded that the government spending multiplier is sharply negative in highly indebted countries. The definition of highly indebted is central government debt exceeding 60% of GDP, a condition that is met by most of the major economies of the world.“
As shown, the difference between the current Federal Debt to GDP ratio and the 100% threshold impacts economic growth. That data is overlaid against the 3-year average nominal GDP growth. Clearly, rising debt levels, much less the threshold, impact economic growth.

The Deleterious Impact On Long-Term Growth
What is evident, as shown above, is that debt is deleterious to long-term growth. As Dr. Hunt concludes by citing peer-reviewed research.
“Third, an econometric study by Alberto Alesina, Carlo Favero and Francesco Giavazzi in the Journal of International Economics in 2015, corroborates that the tax and expenditure multipliers are both negative, with the tax multiplier more negative. Quite significantly, these conclusions are supported by domestic as well as international data. Alesina is a Professor at Harvard, while Favero and Giavazzi are professors at IGIER-Bocconi.
Fourth, Cristina Checherita and Philip Rother, in research for the European Central Bank (ECB) published in 2014, investigated the average effect of government debt on per capita GDP growth in twelve Euro Area countries over a period of about four decades beginning in 1970. Dr. Checherita, now head of the fiscal affairs division of the ECB, and Dr. Rother, chief economist of the European Economic Community, found that government debt to GDP ratio above the turning point of 90-100% has a “deleterious” impact on long-term growth. In addition, they find that there is a non-linear impact of debt on growth beyond this turning point. A non-linear relationship means that as the government debt rises to higher and higher levels, the adverse growth consequences accelerate.”
You may want to re-read that last sentence again.

Disinflation And The Commodity Trade
The surge in “artificial inflation,” from the flood of liquidity against a supply shortage, will revert to a disinflationary trend. Debt and demographics will continue to drive deflationary pressures leading to a reversal of the inflation trade.
As the fear of inflation rose, investors piled into the commodity trade. While commodity prices rose due to the supply shortage, the reversal of that liquidity will undermine those assets.
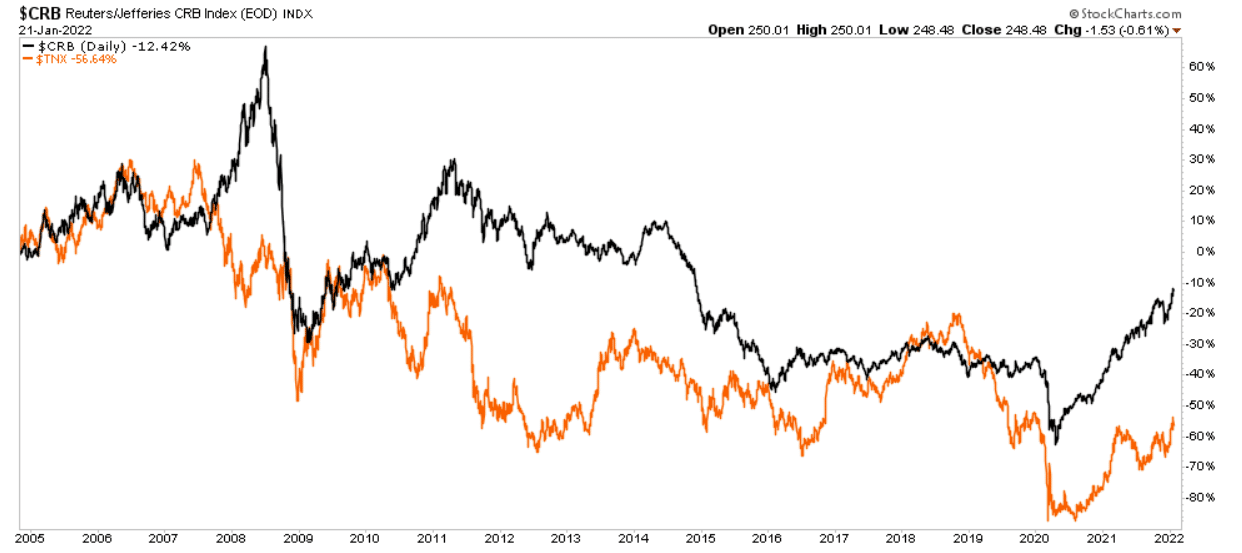
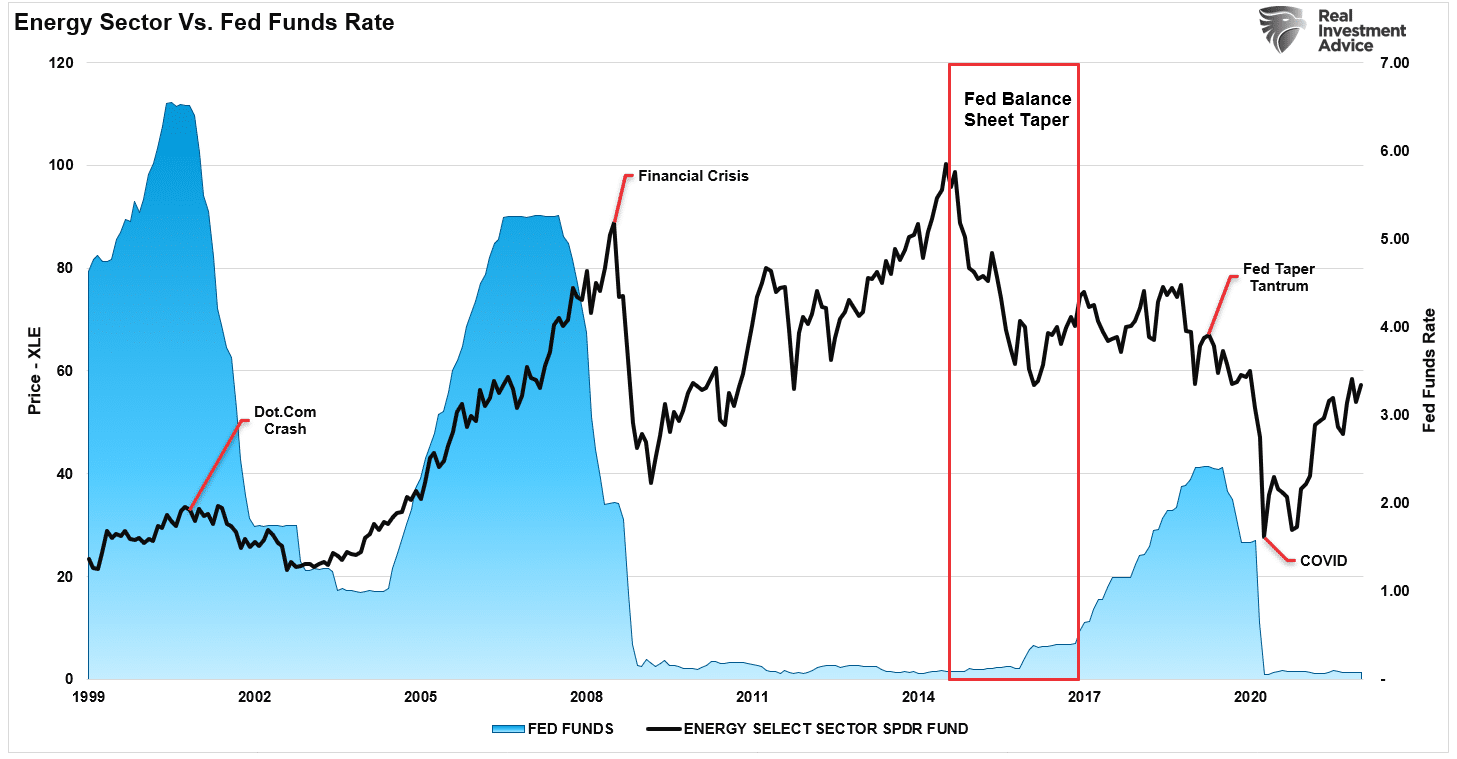
As we showed recently, the reversal in commodity prices will worsen if the Fed proceeds with its monetary tightening.
“Historically, when the Fed hikes rates or tapers its balance sheet, oil prices decline from slower growth and deflationary pressures.” – Real Investment Report 01-21-22
Many continue to compare the current economic environment to the 1970’s inflationary spike. However, the impact of demographics and debt are vastly different.
Throughout 2022, disinflation will likely be the most significant threat to the markets and economy. Such was the point in early 2021 in “Sugar Rush.”
Unless the Government remains committed to a continuous stimulus, once the “sugar rush” fades, the economy will “crash” back to its organic state.
The bottom line is that America can’t grow its way back to prosperity on the back of social assistance. The average American is fighting to make ends meet as their living cost rises while wage growth remains stagnant.
The 3-D’s suggest inflation will give way to deflation, economic strength will weaken, and over-zealous investors will once again get left holding the bag.
Be careful chasing the wrong asset class.
If we are correct, bonds will likely be the best performing asset class in 2022.


Lance Roberts is a Chief Portfolio Strategist/Economist for RIA Advisors. He is also the host of “The Lance Roberts Podcast” and Chief Editor of the “Real Investment Advice” website and author of “Real Investment Daily” blog and “Real Investment Report“. Follow Lance on Facebook, Twitter, Linked-In and YouTube
Customer Relationship Summary (Form CRS)
Also Read


