Cracks Appear In The Market’s Bullish Armor


Inside This Week’s Bull Bear Report
- Cracks Appear In The Market’s Bullish Armor
- How We Are Trading It
- Research Report –Immigration And Its Impact On Employment
- Youtube – Before The Bell
- Market Statistics
- Stock Screens
- Portfolio Trades This Week
Market Confirms Break Of The Bullish Trend
Last week, we discussed the current bullish trend’s ongoing, mind-numbing, narrow channel. We have suggested there was little to worry about until the market violates the 20-DMA. The market confirmed that “crack” to this “unstoppable” bullish rally on Friday. As we noted last week:
“However, as we previously noted, just because the market breaks the 20-DMA does not mean we must take immediate action. What we need to see is a confirmation of that break with either a failed retest of previous support or a further decline. If the market is lower on Monday and takes out Thursday’s low, as shown, this would confirm the break of support and suggest lower prices. The 50-DMA will quickly become the next significant support level.”
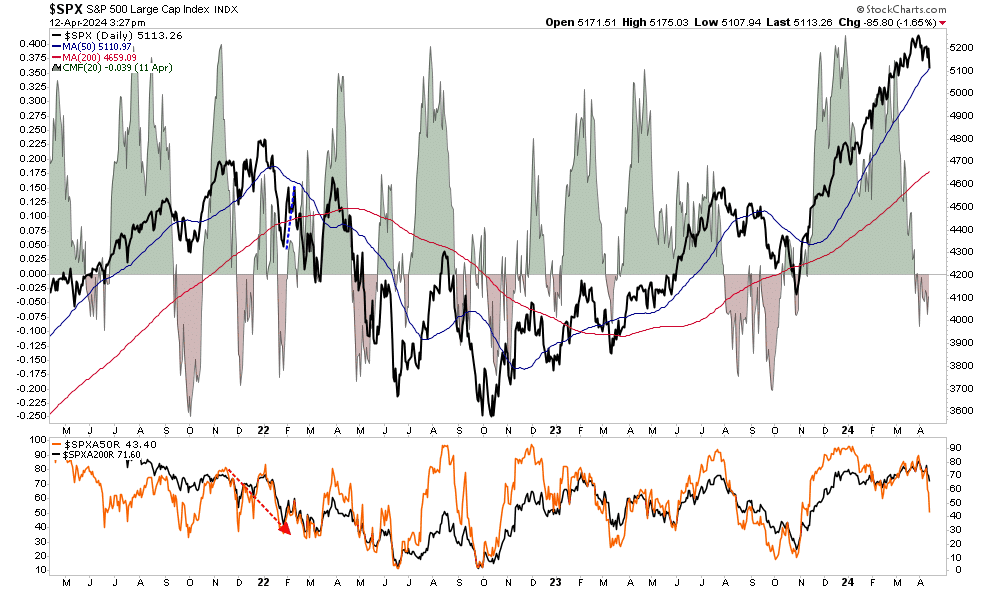
As shown, the market did break below the previous low on Friday after failing to reclaim that previous support at the 20-DMA. The failure to reclaim that support turns the previous 20-DMA into resistance and makes the 50-DMA new critical support over the next few days. (Note: If the market makes a confirmed break of the 50-DMA, the 100- and 200-DMAs become the following logical targets.)
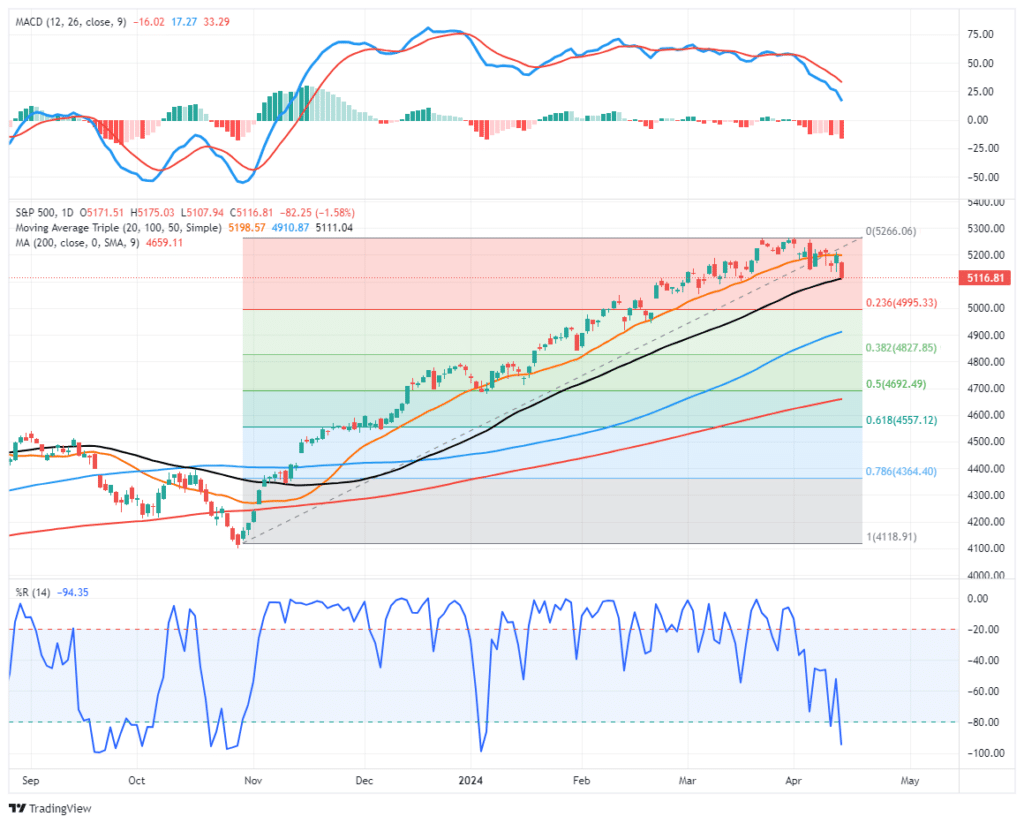
The market is oversold enough for a bounce early next week that investors should use to make further adjustments to portfolio allocations. Crucially, this signal DOES NOT mean to “sell everything and go to cash.”
The confirmed break of support suggests reviewing portfolio allocations and taking profits in well-performing positions. However, while some stocks have only begun to correct from previously overbought conditions, many have already corrected by 10% or more over the last few weeks. Those companies may see inflows as a rotation trade in the market occurs.
In other words, as is always the case, be careful “throwing the baby out with the bathwater.” Opportunities to acquire better-priced companies always exist, even during a corrective process.
What is essential is that there are now cracks in the market’s bullish armor. Let’s dig into that more deeply.
Need Help With Your Investing Strategy?
Are you looking for complete financial, insurance, and estate planning? Need a risk-managed portfolio management strategy to grow and protect your savings? Whatever your needs are, we are here to help.

Cracks Appear In The Market’s Bullish Armor
As we have repeatedly discussed over the last month, the 20-DMA has consistently supported the rally that began in November. Notably, that support cracked over a week ago as geopolitical risks heightened. As we discussed in our Daily Market Commentary:
“However, a rash of Fed speakers left the markets uncertain about the “certainty of rate cuts” this year, sending stocks lower mid-afternoon. Furthermore, international tensions between Iran and Israel raised commodity prices, weighing on market outlooks as the risk of war increased. That selloff broke the market below the 20-DMA trend line, violating that support.”
However, as we noted, just because the market breaks the 20-DMA does not mean we must take immediate action. What we need to see is a confirmation of that break with either a failed retest of previous support or a further decline. On Friday, the stronger-than-expected employment report sent stocks higher as “good news is good news” as more robust economic growth should support earnings. However, “bad news also remains good news,” as it would mean Fed rate cuts.
The market continued to hold support on Monday and Tuesday, but the hotter-than-expected inflation report on Wednesday sent stocks crashing through support once again.
This type of price action shows that cracks are now appearing in the “can’t stop, won’t stop” bull market rally. As such, we will review the market’s short-term technical price action. From that analysis, we can define potential support and resistance levels to pay attention to if a larger correction process is beginning to unfold.
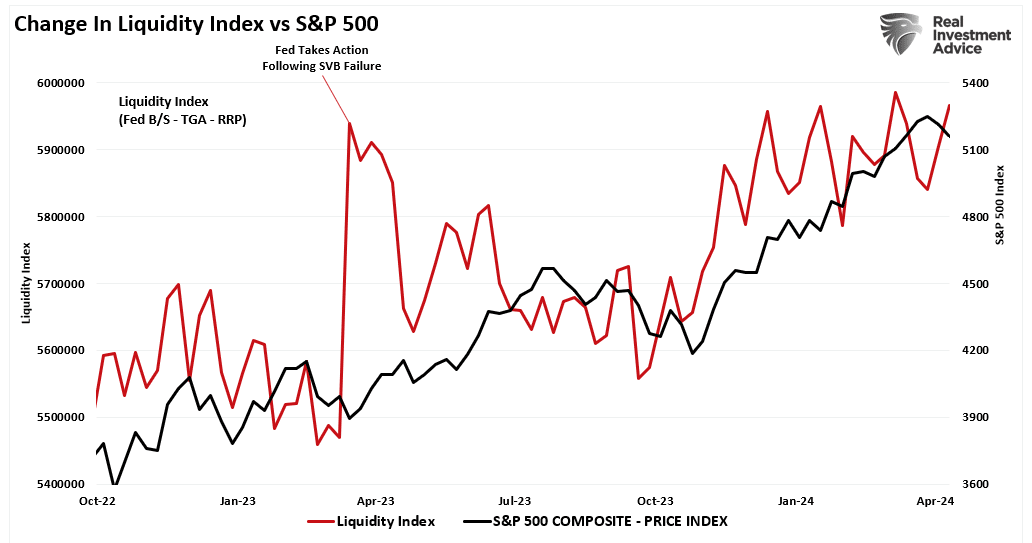
As is always the case, no one knows what will happen next. Such is particularly true in a market still heavily driven by excess liquidity and more extreme bullish sentiment. As shown, the liquidity index remains supportive of the current rally.
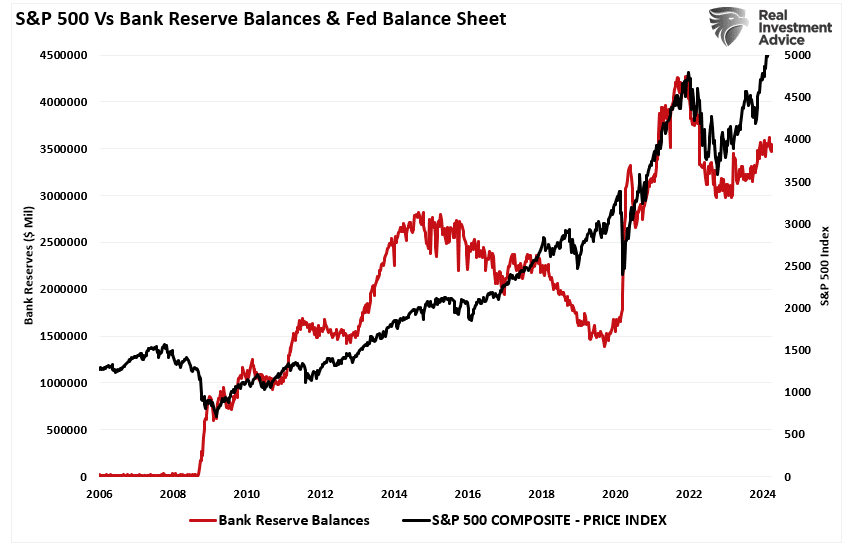
The same goes for overall bank reserves, which have continued to rise since October 2022, when this bull market rally started following the 2022 correction. Notably, those reserves continue to increase despite concerns about overall bank liquidity and stress in regional banks.
Nonetheless, according to our technical review, despite this liquidity flow, several cracks are worth noticing.
Crack No. 1 – A Slowing Of Momentum
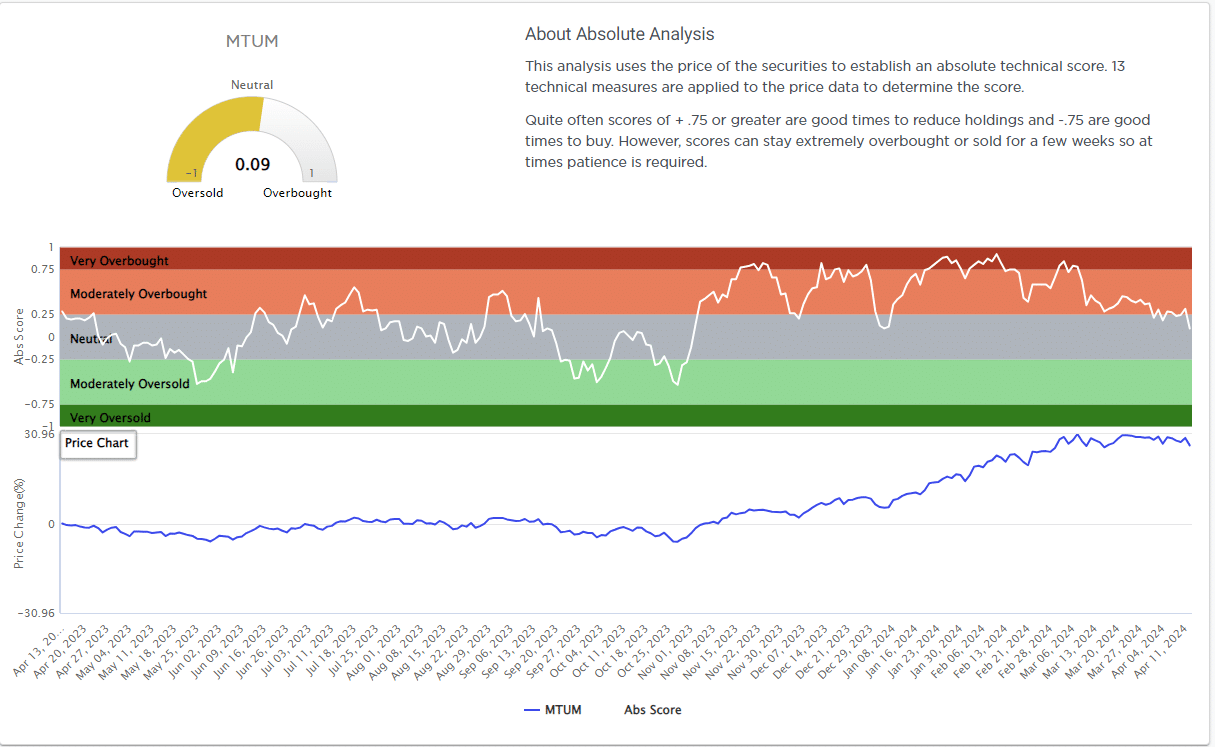
Since the October lows, the chase for equity exposure, particularly in the “artificial intelligence” and “weight loss drug” sectors, has been phenomenal. We can measure that momentum chase by looking at the Momentum ETF (MTUM), which regularly rebalances its holdings for “what’s hot.”
Currently, the Top-10 holdings of MTUM are unsurprising, with some of the biggest high-flyer names dominating the list.
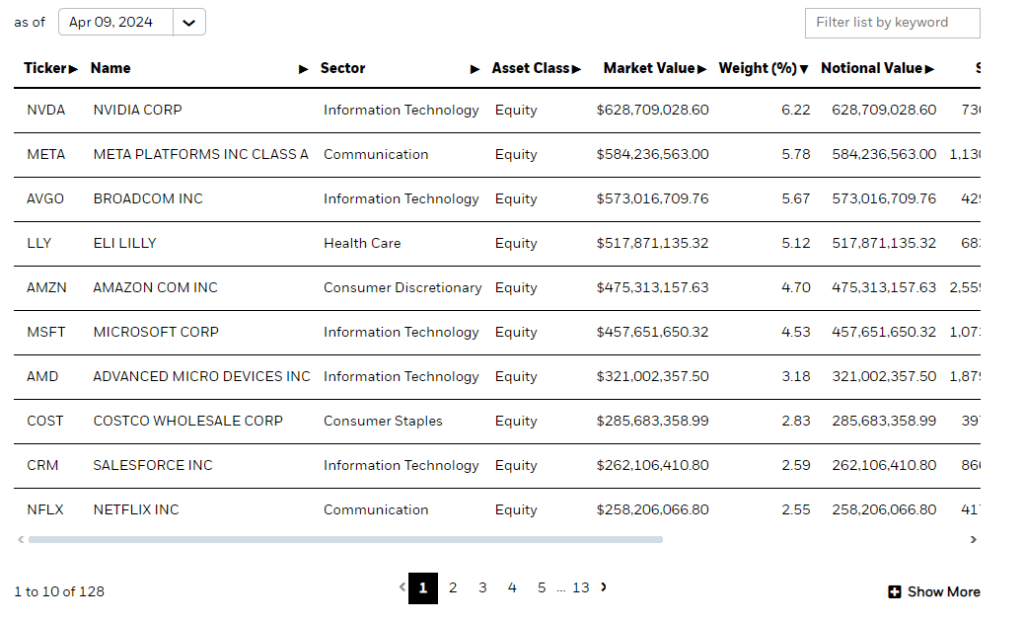
Of course, given that these names are getting the most attention, it is unsurprising that as prices rise, they attract increasing money flows as the chase for performance ensues. Therefore, we can watch MTUM for changes in that “exuberance,” which is progressing. Since the middle of March, the price of MTUM has flatlined, with the absolute score reducing from extremely overbought to just moderately overbought.
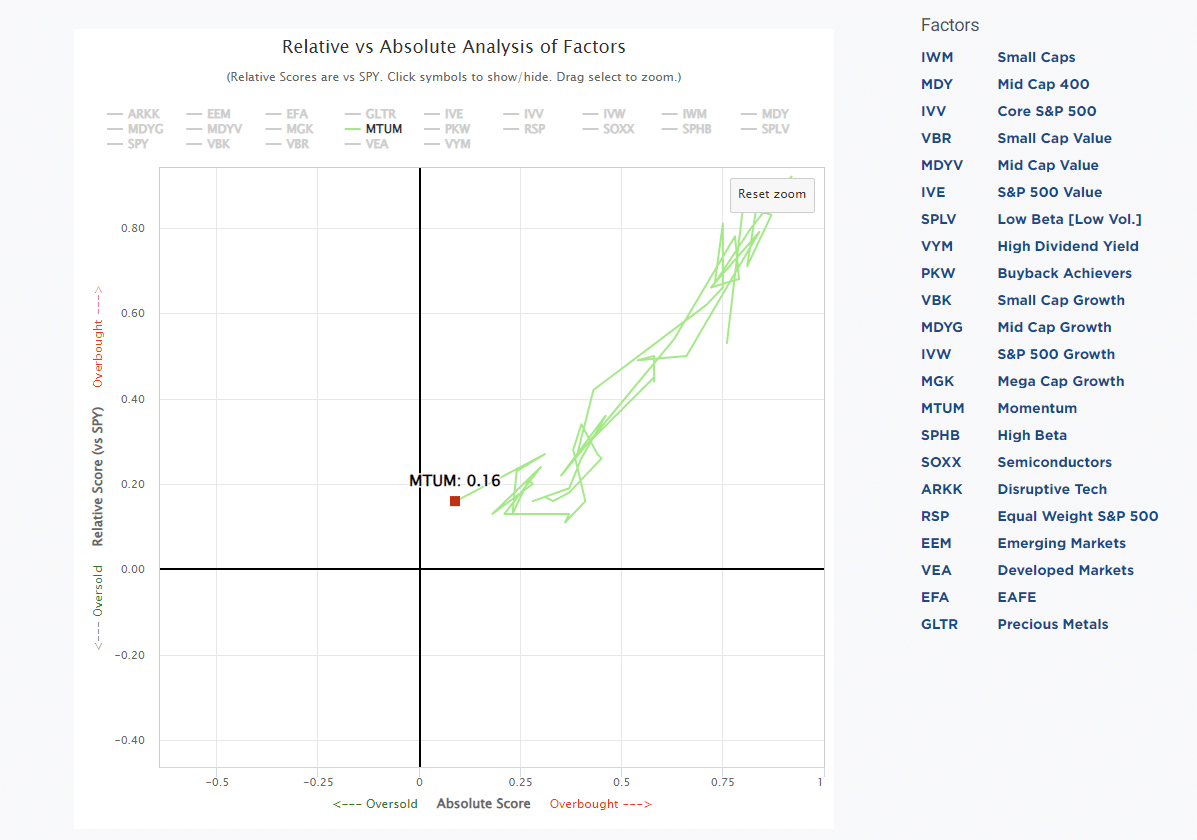
Furthermore, MTUM (momentum stocks) has shown considerable weakness over the last ten weeks.
However, if we look at a chart of the S&P 500 index (where the top 10 holdings are similar to MTUM), the loss of price momentum is visible.
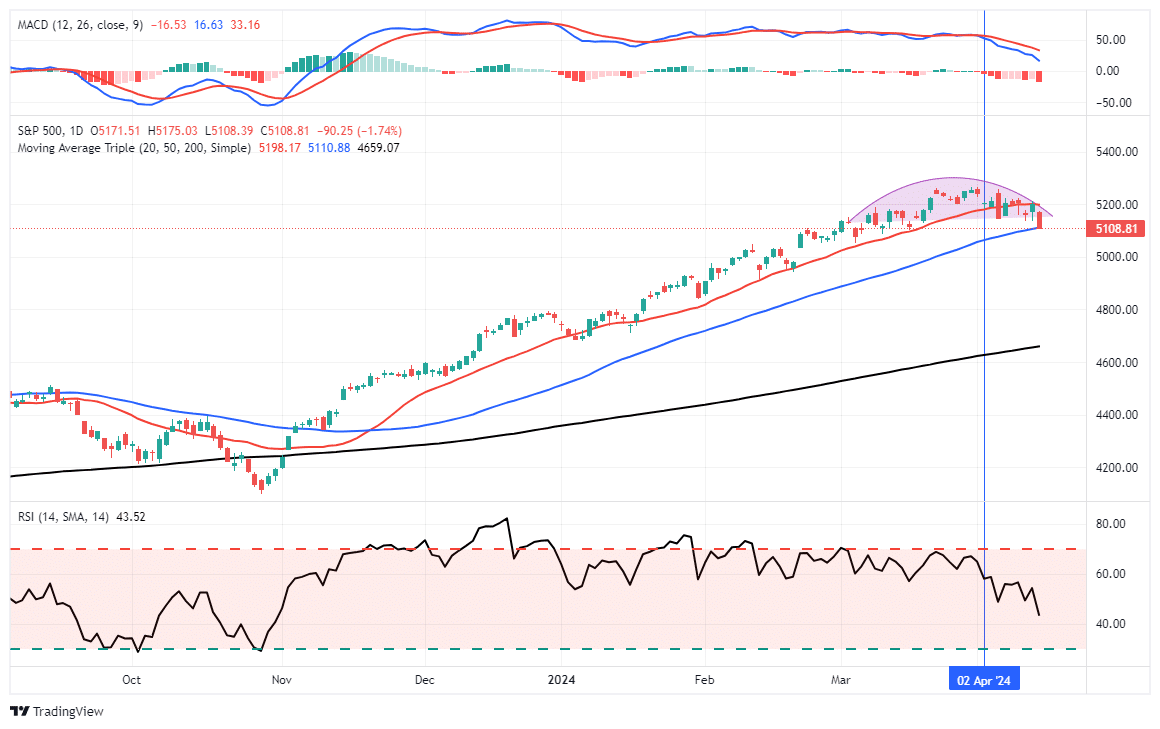
While this loss of momentum suggests that cracks in the market’s bullish armor are growing, it does not mean a deeper correctional process is imminent. However, it is evidence worth paying attention to.
Crack No. 2 – Bullish Sentiment Is Fading
One of the most important aspects of a bull market is investor participation. We can measure participation by monitoring investor sentiment (how they feel about the market) and positioning (how they allocate to equity risk.)
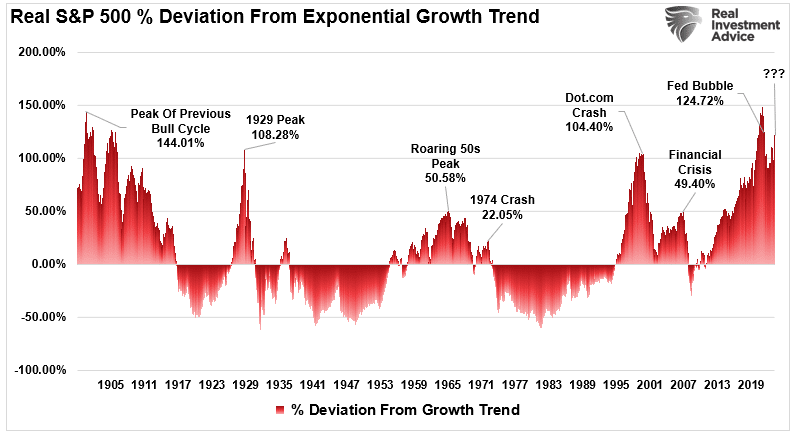
In “Market Bubbles,” we discussed that bull markets, specifically market bubbles, result from investor psychology. To wit:
“When investors bid up asset prices that exceed underlying earnings growth rates, market bubbles have previously been present. The reason is that since economic activity generates revenues and earnings, valuations can not indefinitely exceed the underlying fundamental realities. Since valuations are a function of price and earnings, deviations of the market from the long-term exponential growth trend have marked prior peaks.”
And, when investors are very bullish, they are willing to take on risk by leveraging bets.
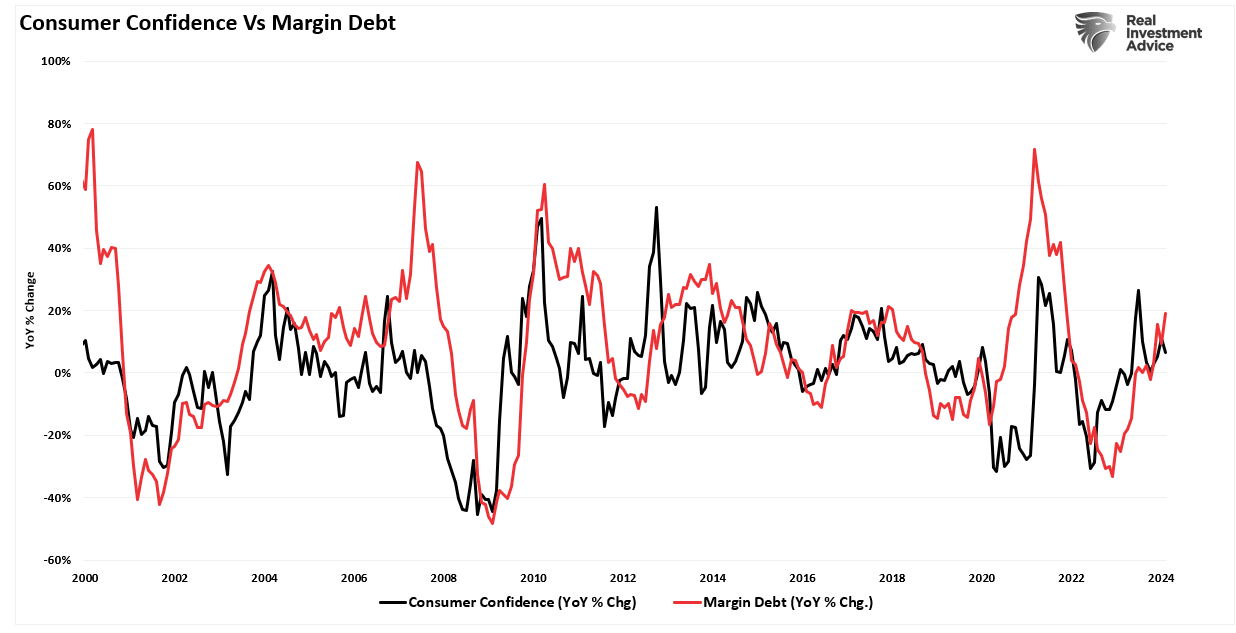
“Unsurprisingly, as consumer confidence improves, so does the speculative demand for equities. As stock markets improve, the “fear of missing out” becomes more prevalent. Such boosts demand for equities, and as prices rise, investors take on more risk by adding leverage.”
Therefore, if psychology drives the markets on the way up, a reversal of that psychology should be essential to monitor for a market change. As Howard Marks previously noted:
“It’s the swings of psychology that get people into the biggest trouble, especially since investors’ emotions invariably swing in the wrong direction at the wrong time. When things are going well people become greedy and enthusiastic, and when times are troubled, people become fearful and reticent. That’s just the wrong thing to do. It’s important to control fear and greed.“
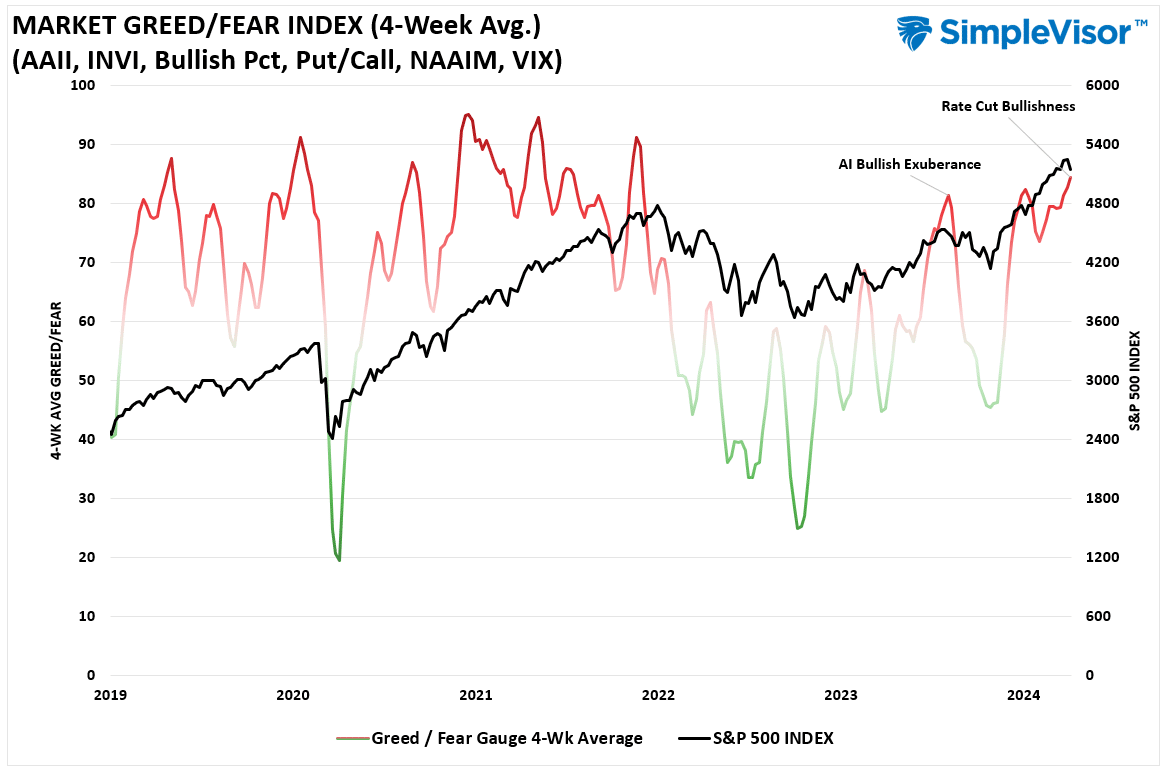
Currently, investor allocations to equities by both professional and retail investors have risen sharply. In July 2023, that allocation reversal propelled the 10% correction through last October. Investor allocations are higher than the previous bullish exuberance. It is worth noting that, like today, the market turned lower before allocation levels declined in earnest.
Secondly, as we saw in 2023, the more extreme bullish sentiment of professional and retail investors peaked above a ratio of 2.5 before the reversal. Over the last six weeks, five of those weeks saw a bull versus bear sentiment ratio above 2.5.
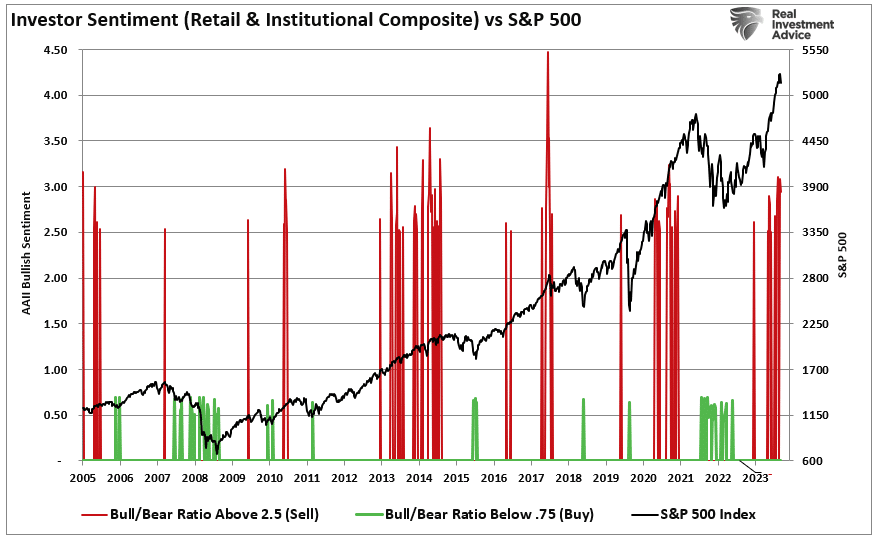
The point is that when everyone is bullish, as they have been over the last two months, few are left to “buy” to keep markets elevated. Such is why money flows are also reversing.
Crack No. 3 – Money Flows Are Reversing
While technicals, sentiment, and positioning are all crucial to market corrections, price action ultimately dictates movement. As explained previously, buyers must coax sellers into a transaction by offering consistently higher prices during rising markets. However, when the market reverses, sellers enter the market, and buyers retract, requiring lower prices to facilitate a transaction. The Wall Street axiom “Sellers live higher, and buyers live lower” is true regarding how markets operate.
One way to see where buyers and sellers are currently “living” is to examine price action. We can visualize how much money flows into and out of the market over time. Prices will rise if more money flows into the market, and vice versa. Therefore, the Chaikin Money Flow Index is an indicator that can help us visualize money flows.
“Developed by Marc Chaikin, Chaikin Money Flow measures the amount of money flowing into an asset over a specific period. Money Flow Volume forms the basis for the Accumulation Distribution Line. Instead of a cumulative total, Chaikin Money Flow sums Money Flow Volume for a specific look-back period, typically 20 or 21 days. The resulting indicator fluctuates above/below the zero line just like an oscillator. Chartists weigh the balance of buying or selling pressure with the absolute level of Chaikin Money Flow. Additionally, chartists can look for crosses above or below the zero line to identify changes on money flow.” – Stockcharts.com
The Chaikin Money Flow Index calculates whether money flows into or out of a stock or index by examining the difference between its high, low, and closing price.
The chart below shows that the Chaikin Money Flow index declined over the last few weeks. Those flows were a warning sign that market participants were slowing their purchases, and sellers were becoming more prevalent. Returning to the market peak in July 2023, we saw a similar warning sign.
As we have been warning over the last few months, we expect a 5-10% correction in the markets to reverse some excess bullish sentiment and positioning. Such an event is a normal and healthy process for the bullish market trends to continue.
Is that correction starting now? Many of our indicators are ringing alarm bells, so we should consider taking action to reduce risks and rebalance exposures as needed.
If this is a repeat of 2023, the next couple of months could get a bit rough.
How We Are Trading It
There is no magic formula for managing portfolios; everyone does it differently. However, as we often discuss, a few practices can significantly reduce the risk of an unexpected market correction.
As noted, there is an apparent crack in the market that suggests investors should take some portfolio actions. While we have discussed these simplistic rules over the last several weeks, it is time to rebalance risk if you have an allocation to equities.
- Tighten up stop-loss levels to current support levels for each position.
- Hedge portfolios against major market declines.
- Take profits in positions that have been big winners
- Sell laggards and losers
- Raise cash and rebalance portfolios to target weightings.
Notice, nothing in there says “sell everything and go to cash.”
Remember, our job as investors is pretty simple – protect our investment capital from short-term destruction so we can play the long-term investment game. Here are our thoughts on this.
- Capital preservation is always the primary objective. If you lose your capital, you are out of the game.
- Seek a rate of return sufficient to keep pace with the inflation rate. Don’t focus on beating the market.
- Keep expectations based on realistic objectives. (The market does not compound at 8%, 6% or 4%)
- Higher rates of return require an exponential increase in the underlying risk profile. This tends to never work out well.
- You can replace lost capital – but you can’t replace lost time. Time is a precious commodity that you cannot afford to waste.
- Portfolios are time-frame specific. If you have a 5-year retirement horizon but build a portfolio with a 20-year time horizon (taking on more risk), the results will likely be disastrous.
Keep moves small for now. As the markets confirm their next direction, we can continue adjusting accordingly.
Have a great week.
Research Report

Subscribe To “Before The Bell” For Daily Trading Updates
We have set up a separate channel JUST for our short daily market updates. Please subscribe to THIS CHANNEL to receive daily notifications before the market opens.
Click Here And Then Click The SUBSCRIBE Button
Subscribe To Our YouTube Channel To Get Notified Of All Our Videos
Bull Bear Report Market Statistics & Screens

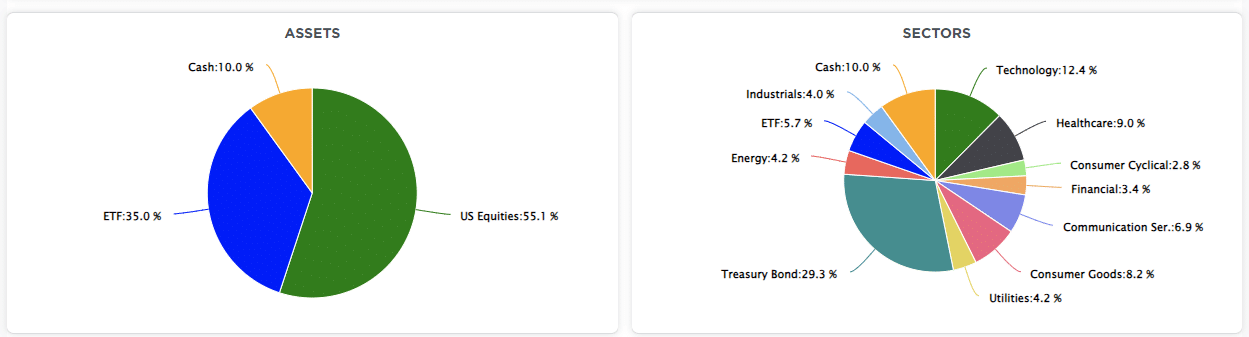
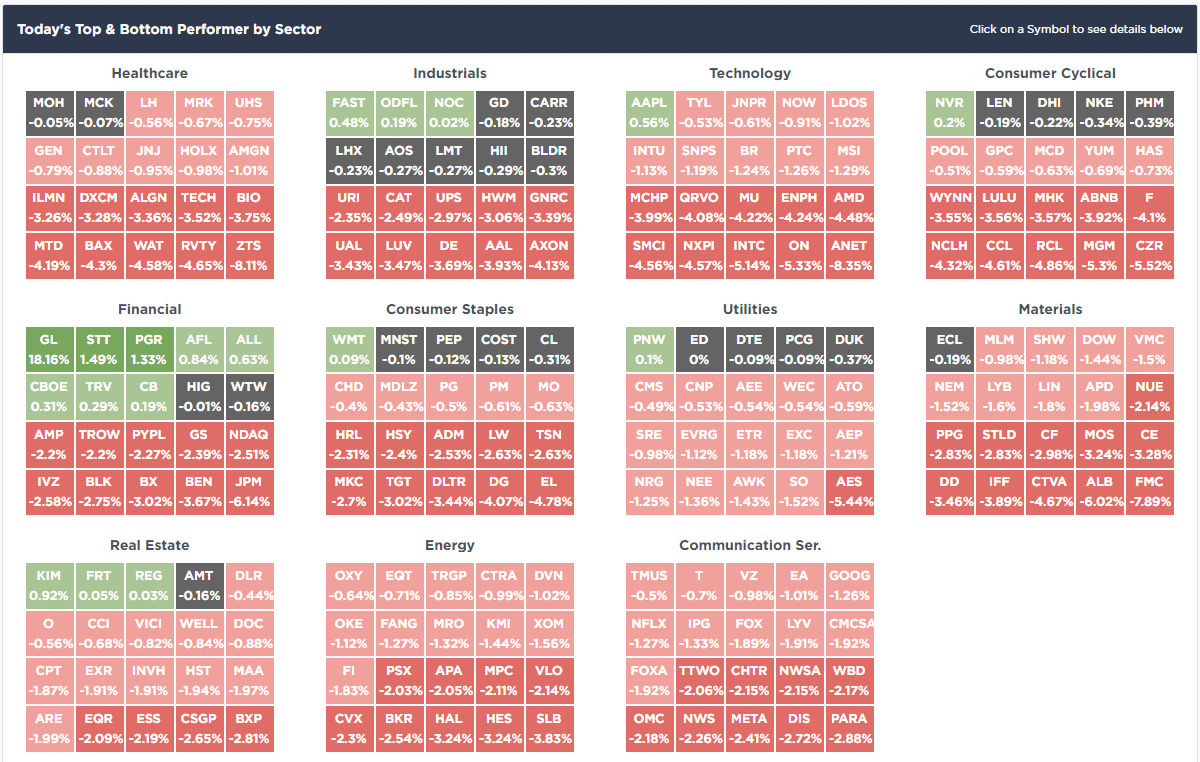
SimpleVisor Top & Bottom Performers By Sector
S&P 500 Weekly Tear Sheet
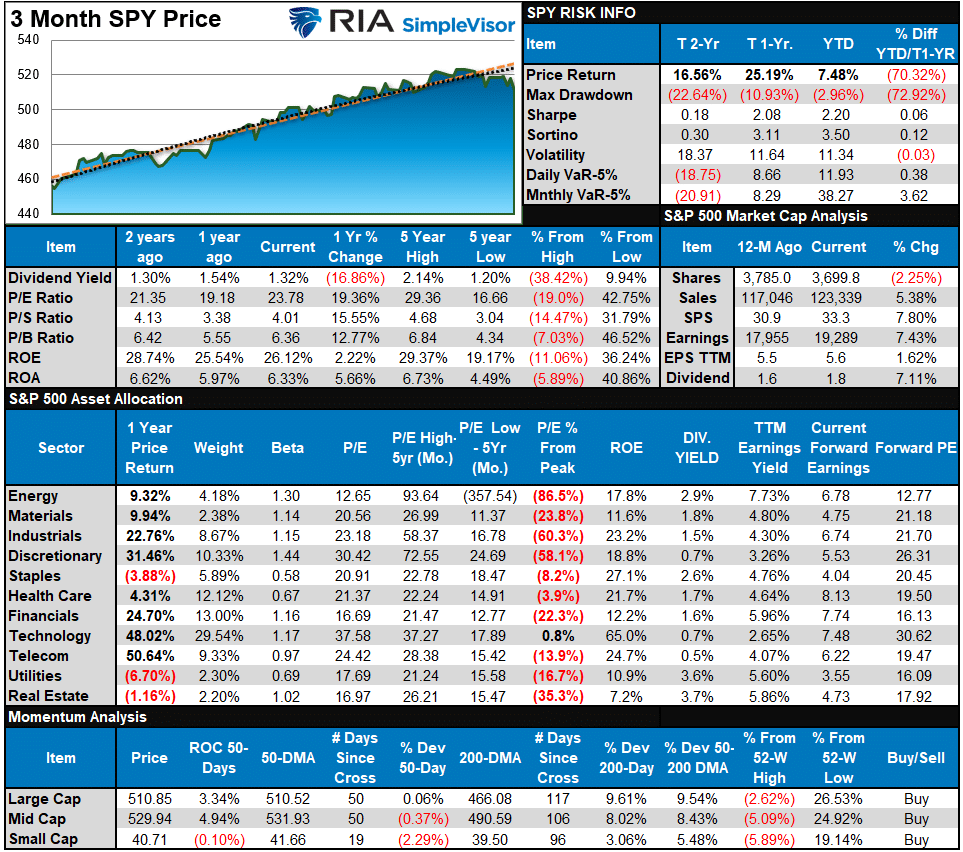
Relative Performance Analysis
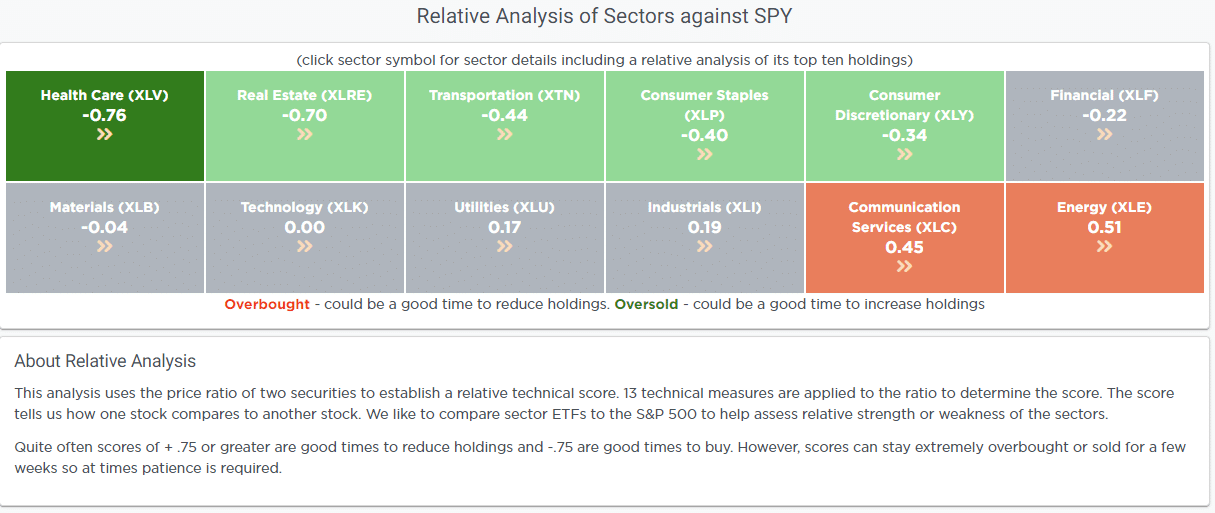
As noted last week:
“That reversal came on Thursday this past week, except for Energy, reducing much of the previous overbought condition. While the recent correction still has some additional work, some froth is getting worked off. Bonds have become oversold, and we will likely see some buying pressure ahead.”
On Monday and Tuesday, we saw additional buying, pushing the market back above the 20-DMA. However, the inflation data on Wednesday sparked a turn in market sentiment, sending stocks to the 50-DMA on Friday. As shown below, almost every sector is now very oversold. Expect buyers to step in early next week to defend that support level but use any rally to reduce exposure as needed to rebalance portfolio risk. We have likely started a correction or consolidation process that could last several weeks.
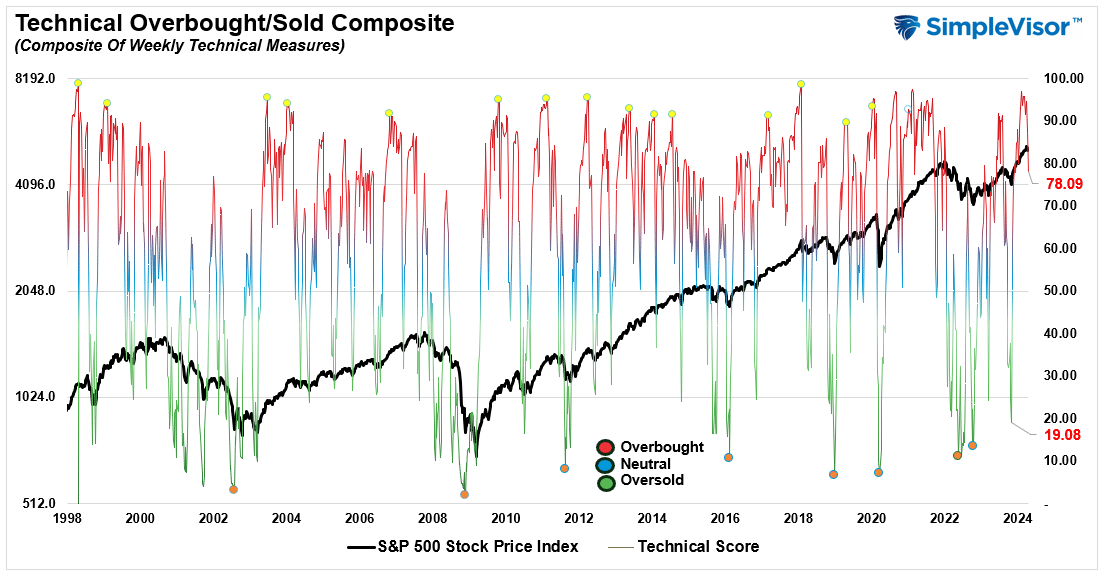
Technical Composite
The technical overbought/sold gauge comprises several price indicators (R.S.I., Williams %R, etc.), measured using “weekly” closing price data. Readings above “80” are considered overbought, and below “20” are oversold. The market peaks when those readings are 80 or above, suggesting prudent profit-taking and risk management. The best buying opportunities exist when those readings are 20 or below.
The current reading is 78.09 out of a possible 100.
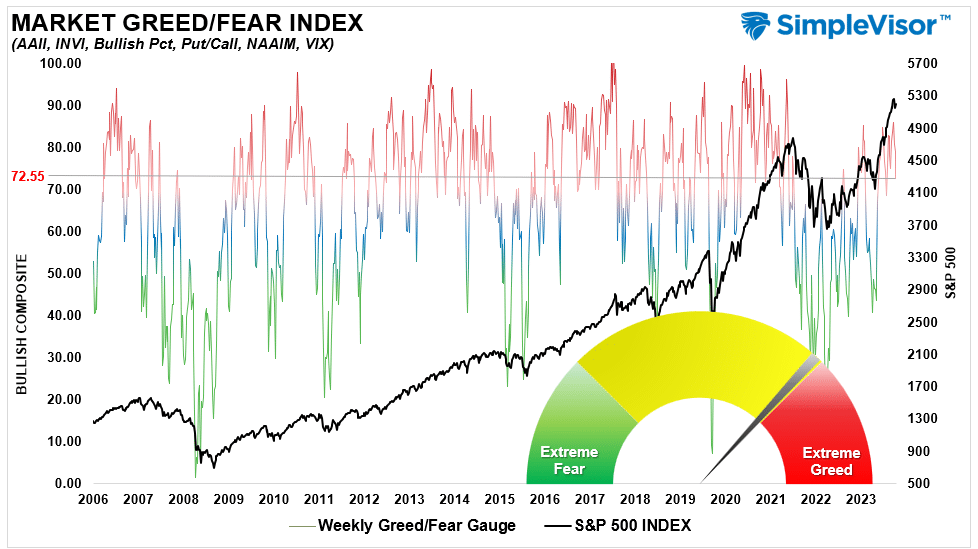
Portfolio Positioning “Fear / Greed” Gauge
The “Fear/Greed” gauge is how individual and professional investors are “positioning” themselves in the market based on their equity exposure. From a contrarian position, the higher the allocation to equities, the more likely the market is closer to a correction than not. The gauge uses weekly closing data.
NOTE: The Fear/Greed Index measures risk from 0 to 100. It is a rarity that it reaches levels above 90. The current reading is 72.55 out of a possible 100.
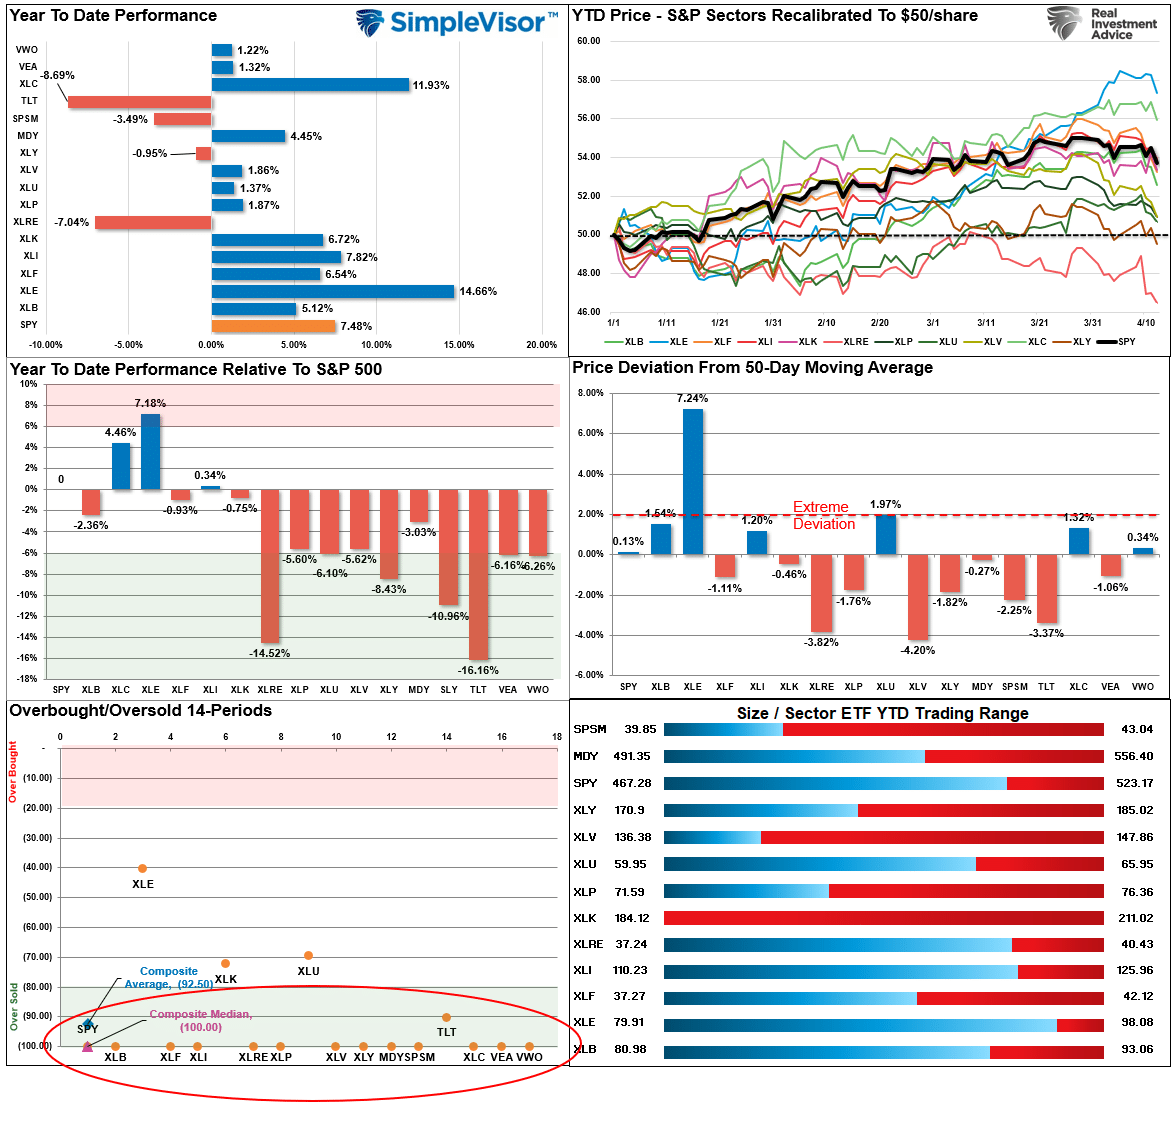
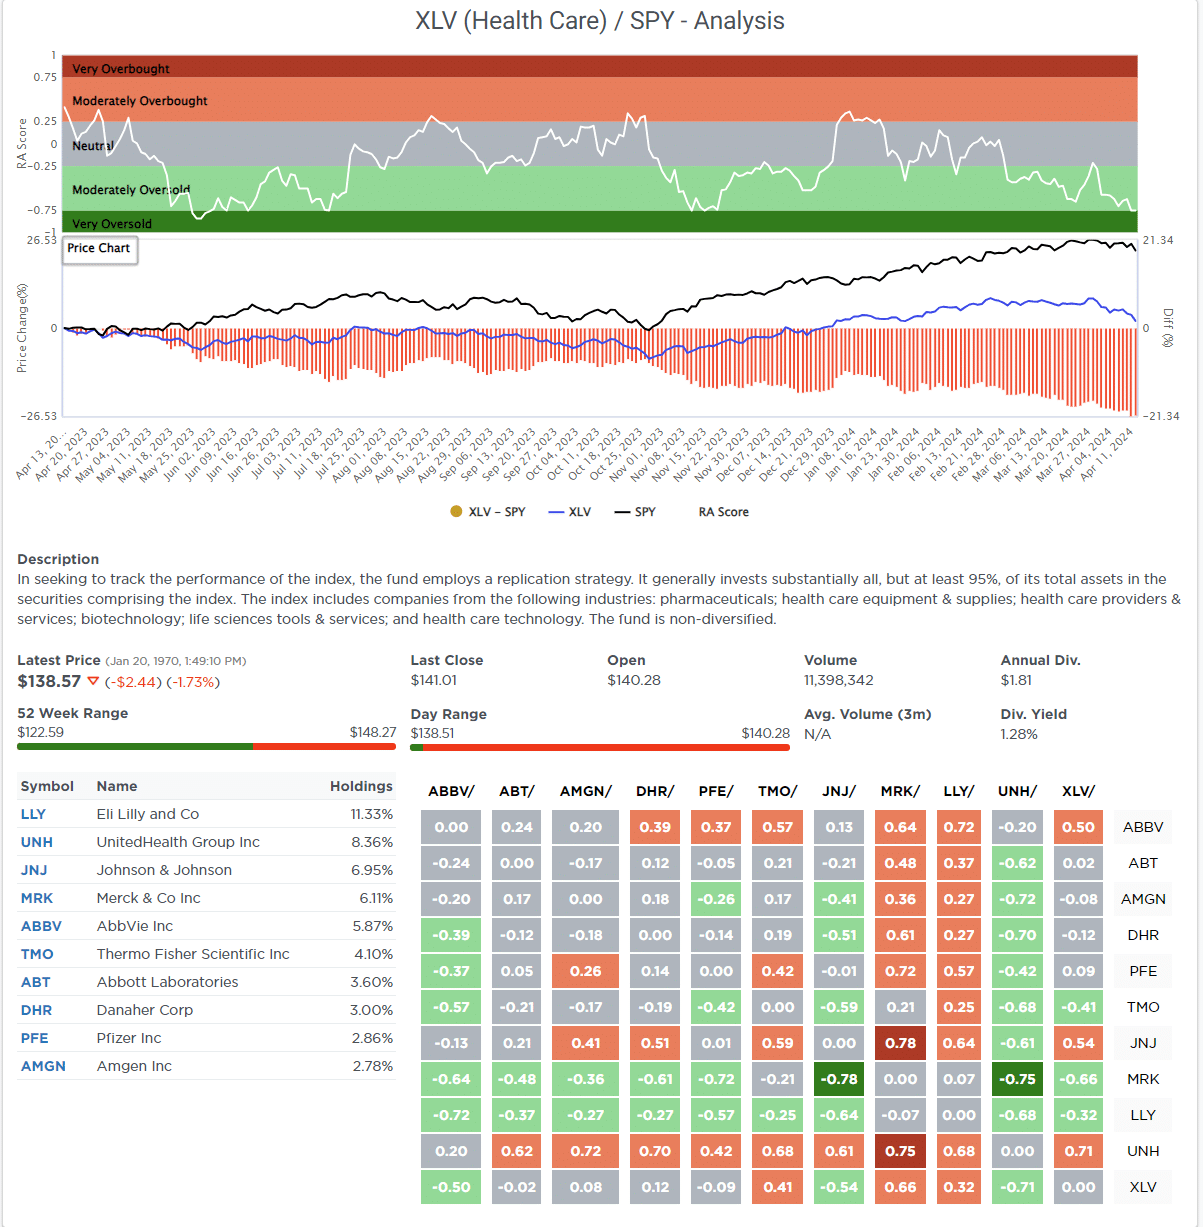
Relative Sector Analysis
Most Oversold Sector Analysis
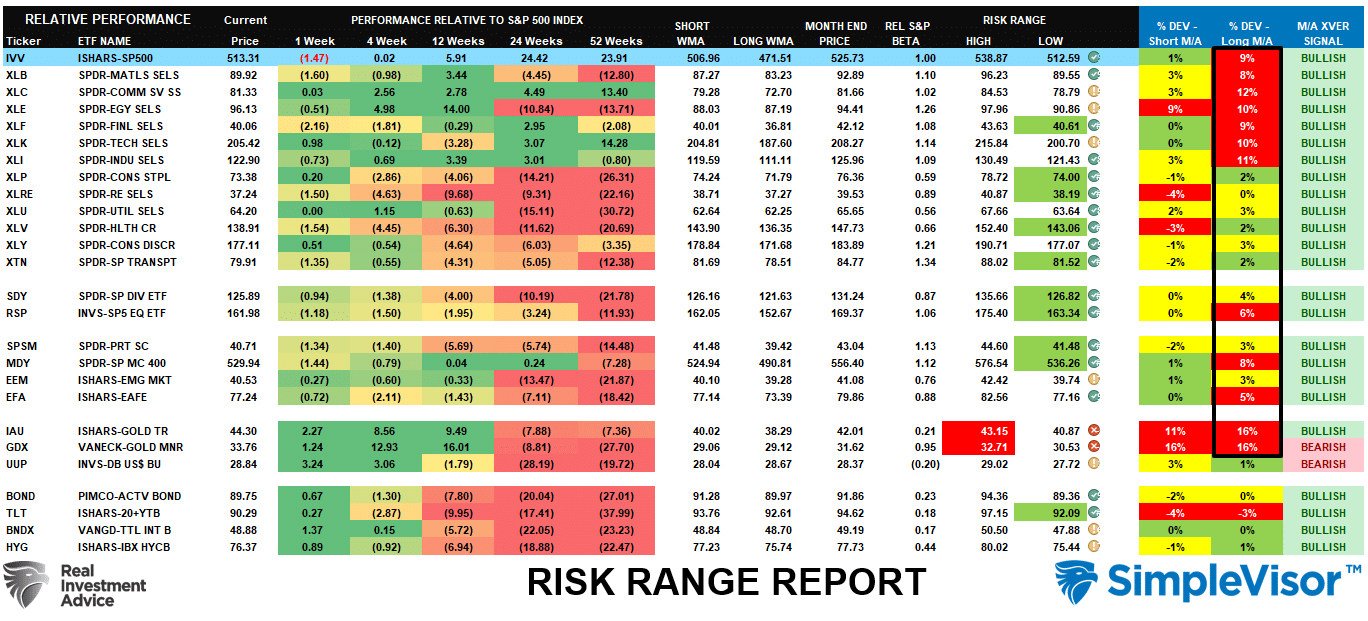
Sector Model Analysis & Risk Ranges
How To Read This Table
- The table compares the relative performance of each sector and market to the S&P 500 index.
- “MA XVER” (Moving Average Crossover) is determined by the short-term weekly moving average crossing positively or negatively with the long-term weekly moving average.
- The risk range is a function of the month-end closing price and the “beta” of the sector or market. (Ranges reset on the 1st of each month)
- The table shows the price deviation above and below the weekly moving averages.
The selloff that began on Wednesday reversed some of the market’s very short-term overbought conditions. Several sectors, including bonds, are oversold and will likely bounce soon. While the longer-term deviations remain extreme, suggesting we could see a deep correction at some point, most markets and sectors are on BULLISH BUY signals. Given this is weekly data, those bullish buy signals suggest that asset prices will likely be higher than lower in the coming months. Therefore, correction processes should be used to increase equity exposures when oversold levels are present.
Weekly SimpleVisor Stock Screens
We provide three stock screens each week from SimpleVisor.
This week, we are searching for the Top 20:
- Relative Strength Stocks
- Momentum Stocks
- Fundamental & Technical Strength W/ Dividends
(Click Images To Enlarge)
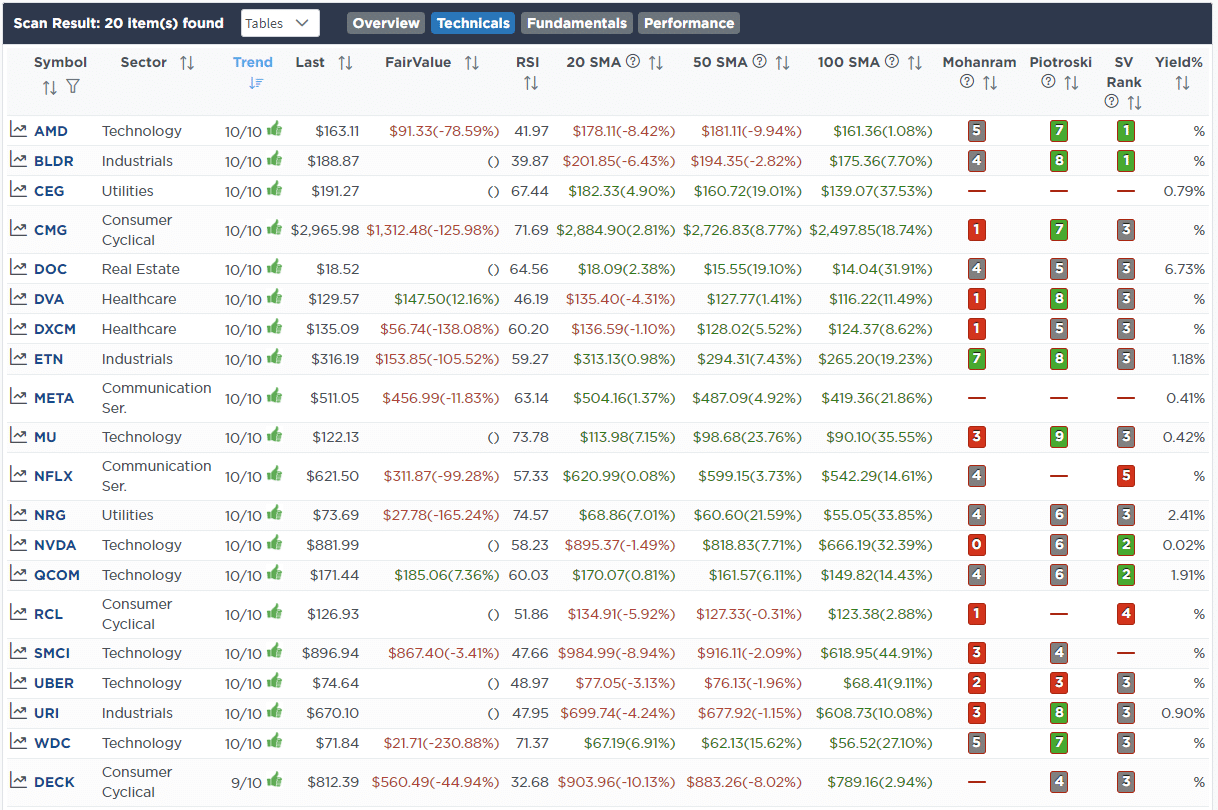
R.S.I. Screen
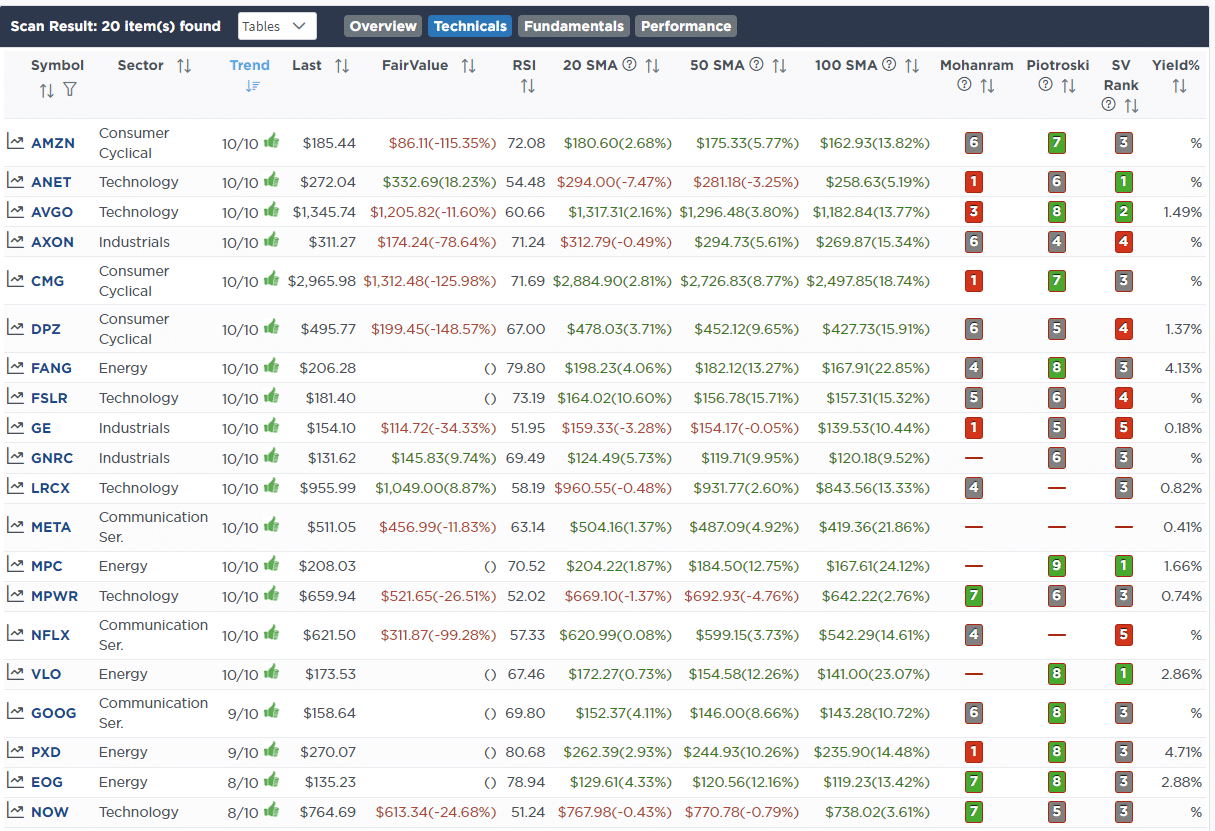
Momentum Screen
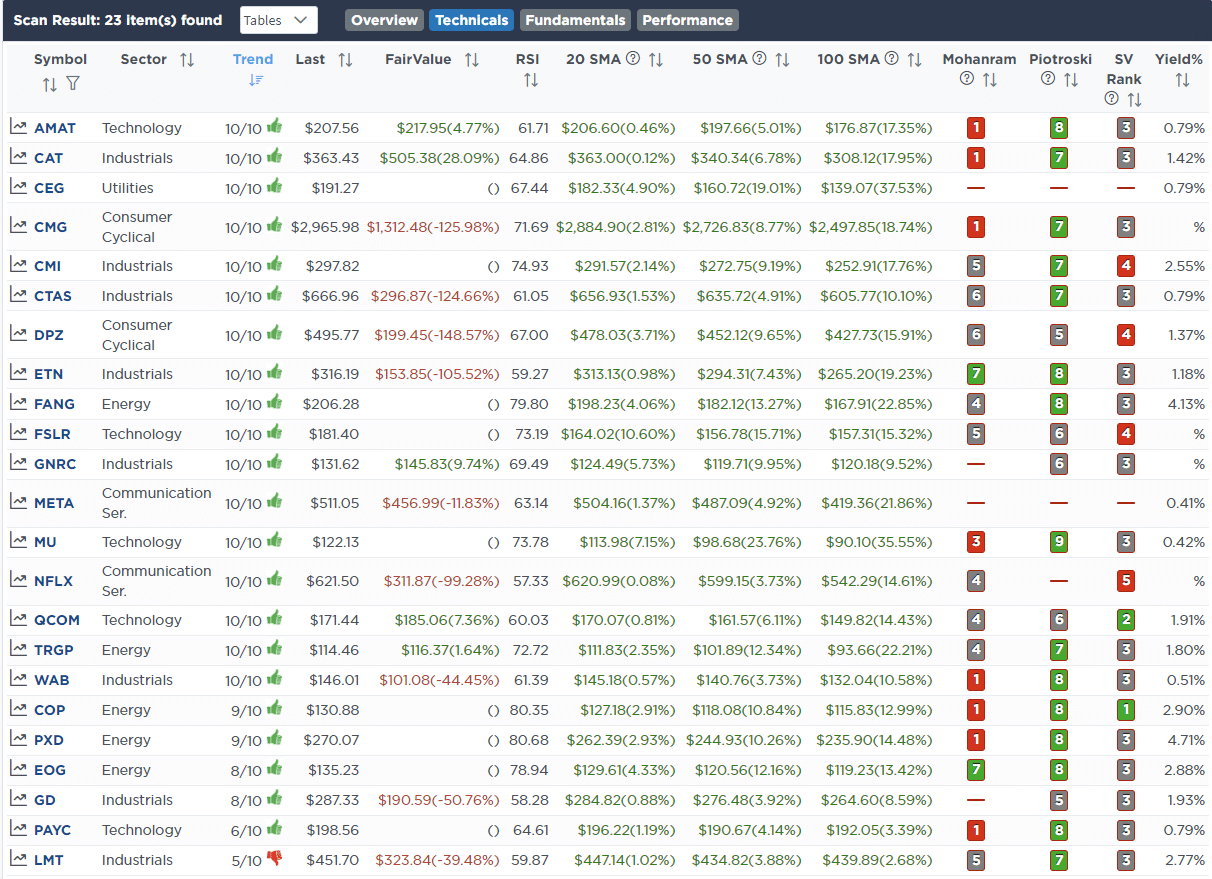
Fundamental & Technical Strength
SimpleVisor Portfolio Changes
We post all of our portfolio changes as they occur at SimpleVisor:
No Trades This Week

Lance Roberts, C.I.O.
Have a great week!


