


In this 09-24-21 issue of “‘Correction Is Over, Bulls Jump Back Into The Risk Pool“
- Correction Is Over
- Fed Threads The Needle On Taper.
- 3-Signs For The Next Bear Market
- Portfolio Positioning
- Sector & Market Analysis
- 401k Plan Manager
Follow Us On: Twitter, Facebook, Linked-In, Sound Cloud, Seeking Alpha
Is It Time To Get Help With Your Investing Strategy?
Whether it is complete financial, insurance, and estate planning, to a risk-managed portfolio management strategy to grow and protect your savings, whatever your needs are, we are here to help.
Schedule your “FREE” portfolio review today.

Correction Is Over As Bulls Jump Back Into The “Risk Pool.”
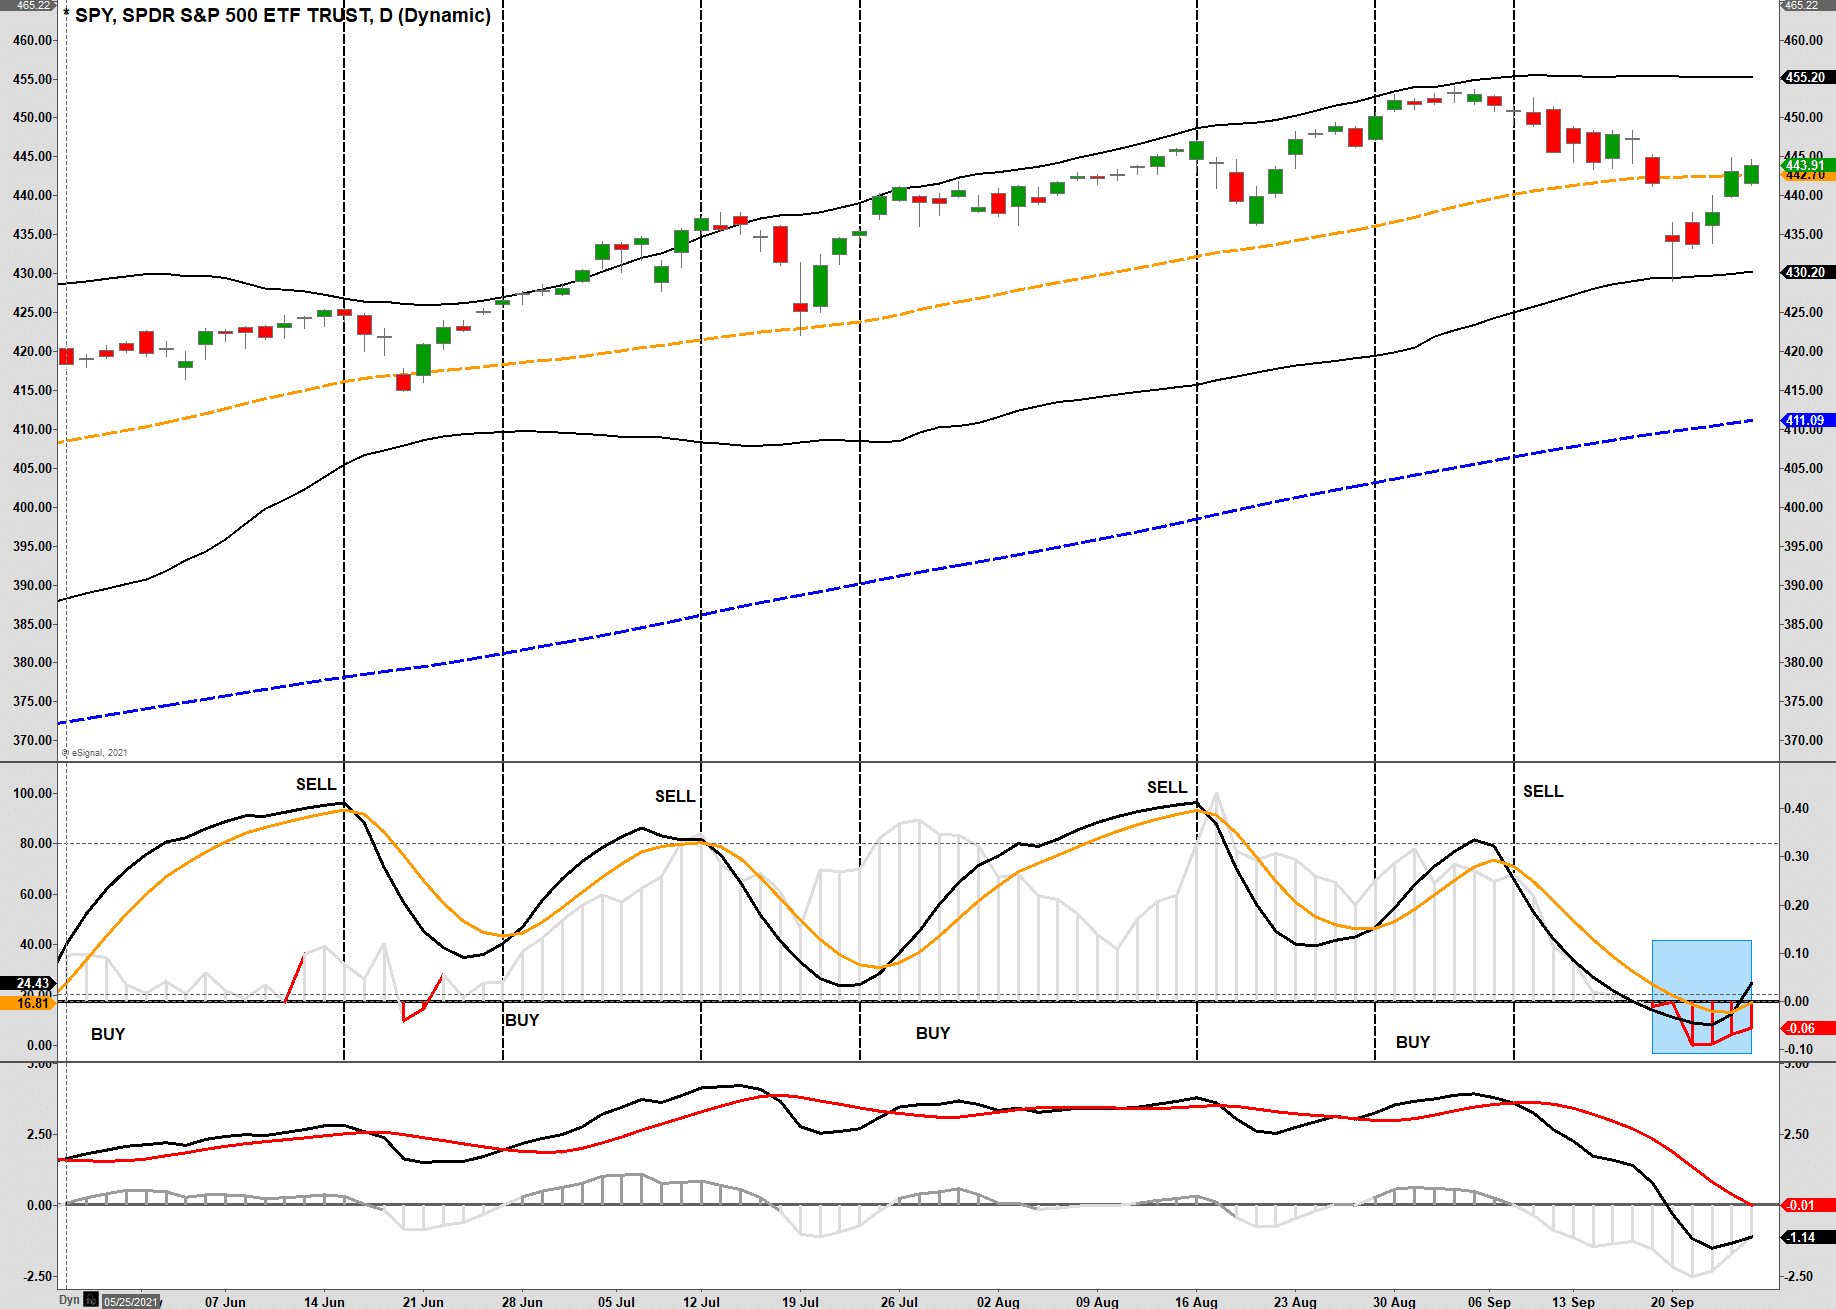
As noted last week, retail investors didn’t step in right away to buy the dip at the 50-dma. However, they did show up on Monday afternoon and continued to buy through the rest of the week.
“With the market very oversold, a counter-trend bounce next week will not be a surprise. However, if the market fails to hold the 50-dma, the risk of a more substantial correction is likely.”
Notably, two essential things occurred this week. The market regained its 50-dma and triggered our RIAPRO Money Flow “buy” signal. Both suggest that bulls have regained control, and we could see some follow-through buying next week.
Over the past several weeks, in various forms, we discussed our reduction in risk by rebalancing equities, raising cash, and extending our duration in our bond portfolio. To wit:
“With volatility currently at the lows of its recent range, a pick-up in volatility would not be surprising. Over the last 6-months, corrections remain range-bound to the 50-dma which is currently 3% lower than closing levels. While such a decline is well within the norms of a correction in any given market year, the low levels of volatility will make it ‘feel’ worse than it is.
With money flows continuing to weaken and technical indicators setting up to produce sell signals, we reduced exposure a bit more this week by increasing cash and reducing our financial holdings. “ – August 13th.
With the markets now deeply oversold on a short-term basis, we deployed some of our cash throughout the week to rebalance the portfolio toward normal allocation levels.
We don’t expect a tremendous amount of upside, given the ongoing weakness of market internals, but a retest of previous highs is not out of the question. Particularly since the Fed “threaded the needle.”

The Fed Threads The Needle On Taper
For weeks now, the Fed has been prepping the market for “taper talk.” Stocks sold off a bit in anticipation of the announcement, effectively “pricing in” a mildly hawkish stance. Jerome Powell did not fail to deliver during his press conference by announcing taper with no timeline.
- With respect to progress towards taper, Powell commented, “In my own thinking, the test is all but met”.
- “I think if the economy continues to progress broadly in line with expectations and the overall situation is appropriate for this, we could easily move ahead [with taper] by next meeting, or not…”
- Again, with respect to a decision for November taper, “I don’t need to see a good employment report next month; I just need to see a decent employment report”. Powell is clearly signaling that Fed is likely to announce taper in November barring an unexpected deterioration in economic conditions.
- Powell commented that it may be appropriate for taper to conclude by mid-2022.
- As expected, Powell left a back door open in case taper doesn’t go over well. “If necessary, we can accelerate or decelerate the taper”.
As we noted in our Daily Market Commentary (subscribe for pre-market delivery):
“The Fed has done a decent job of telegraphing when tapering is likely to begin (most market participants believe the announcement will come this year), but more importantly it’s because the asset purchase reductions are likely to be trivial when seen in the context of how large the fixed income markets are today, and how overwhelming the demand for income has become.” – Rick Rieder, BlackRock’s CIO of Global Fixed Income
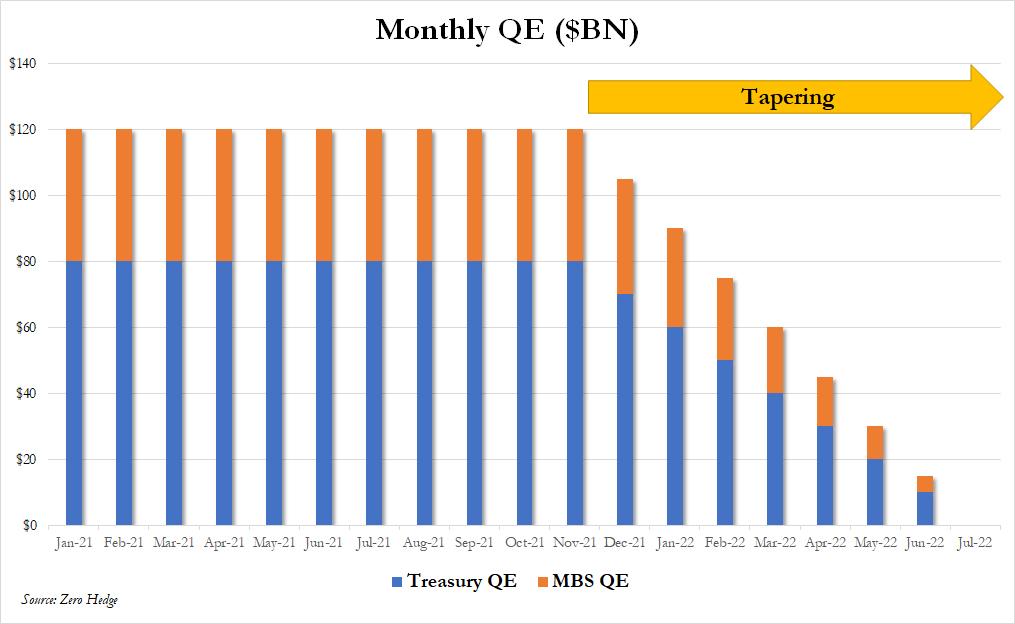
From the market’s perspective, a $15 billion reduction in purchases says the Fed isn’t removing the “punch bowl.” However, as shown in the table below, taper becomes an issue in 2022.

3-Signs Of The Next Bear Market
I previously warned that during the subsequent 5% correction, it would “feel” much worse than it was. However, gauging by the number of emails asking about the “crash,” why we weren’t heavily short the market, and we were crazy for “buying” the recent lows, it is clear sentiment has gotten extremely negative.
The question I received the most was, “Is this the beginning of a bear market?”
The answer is “no.”
Currently, bullish sentiment remains high, global liquidity flows are strong, and stock buybacks are at a record.
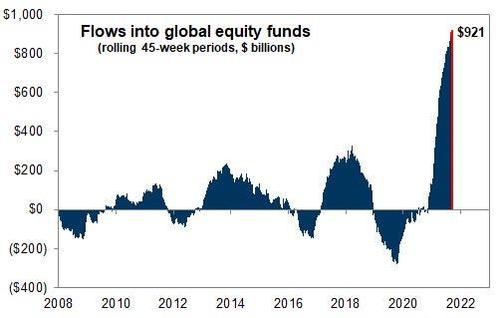
While those issues are supportive of stocks currently, they are also dependent on rising asset prices.
So, for investors, there are 3-signs that will signal the next bear market or recession is approaching, requiring a more defensive investment posture.
In Case You Missed It
Yield Curve Inversion (Not Yet)
The yield curve is one of the most important indicators for determining when a recession, and a subsequent bear market, approaches. The chart below shows the percentage of yield curves that invert out of 10-possible combinations.
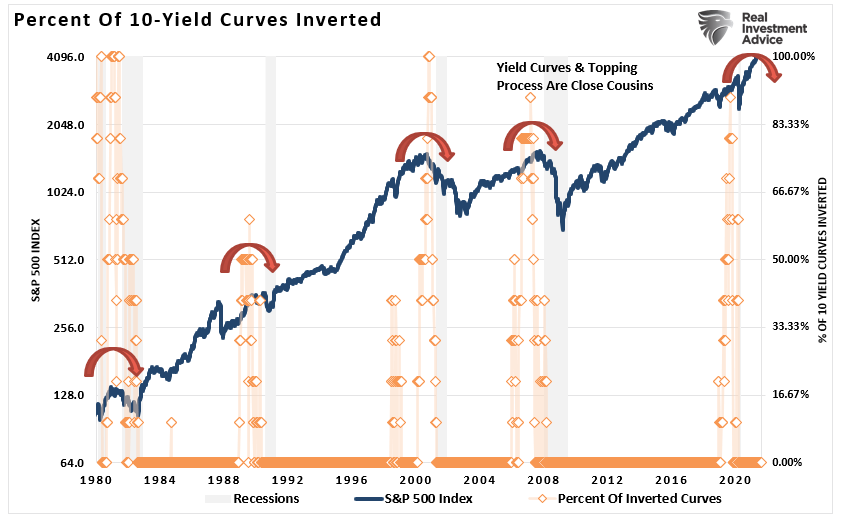
At the moment, given there are no inversions, there is no immediate risk of a recession or “bear market. “
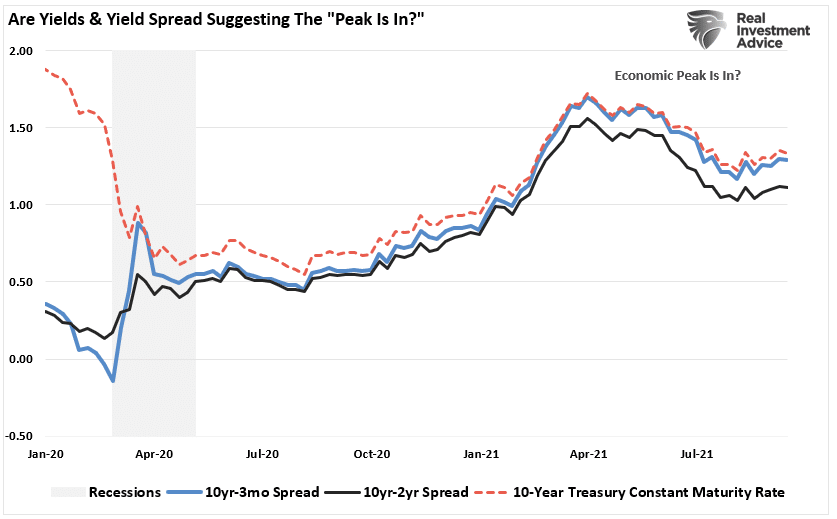
Historically speaking, from the time yield curves begin to invert, the span to the next recession runs roughly 9-months. However, note that yield curves are currently declining, suggesting economic growth will weaken. If this trend continues, another “inversion” would not be a surprise.
Given the strong track record of predicting recessions historically, when the subsequent inversion occurs, the media will quickly dismiss it just as they did in 2019.
Such would not be a wise thing to do.
Fed Taper (Coming)
The issue of “tapering” is not as much about the Fed’s actual reduction of bond purchases as it is about psychology.
“The key to navigating Quantitative Easing and Fed policy in general is to recognize that their effect on the stock market relies almost entirely on speculative investor psychology. As long as investors get inclined to speculate, they treat zero-interest money as an inferior asset, and they will chase any asset with a yield above zero (or a past record of positive returns). Valuation doesn’t matter because investors psychologically rule out the possibility of price declines in the first place.” – John Hussman
In other words, “QE” is a mental formation. Therefore, the only thing that alters the effectiveness of the Fed’s monetary policy is investor psychology itself. As shown, there is a very high correlation between the expansion of the Fed’s balance sheet and asset price increases.
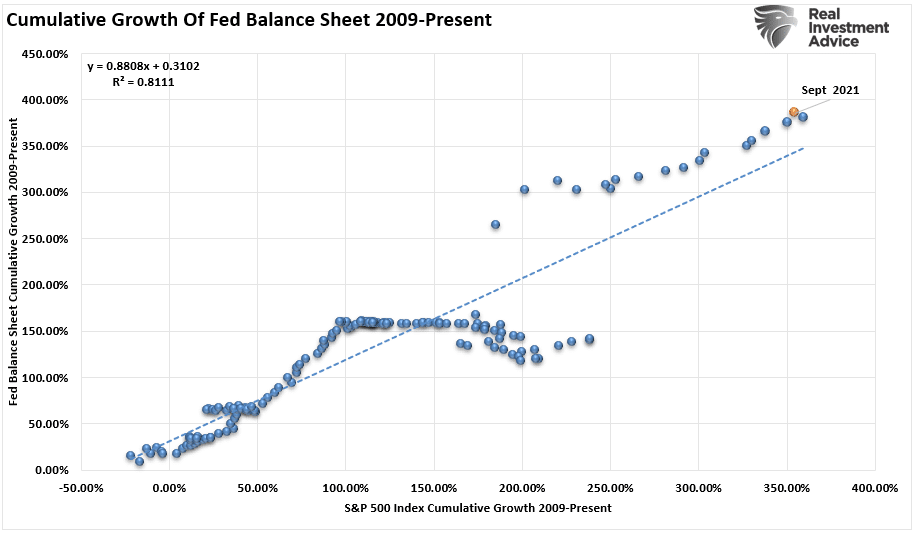
Whether the correlation is due to liquidity moving into assets through leverage or just the “psychology” of the “Fed Put,” the result is the same.
Therefore, it should also not be surprising that when the Fed starts “tapering” their bond purchases, the market tends to witness increased volatility. The grey shaded bars in the chart below show when the balance sheet is either flat or contracting.
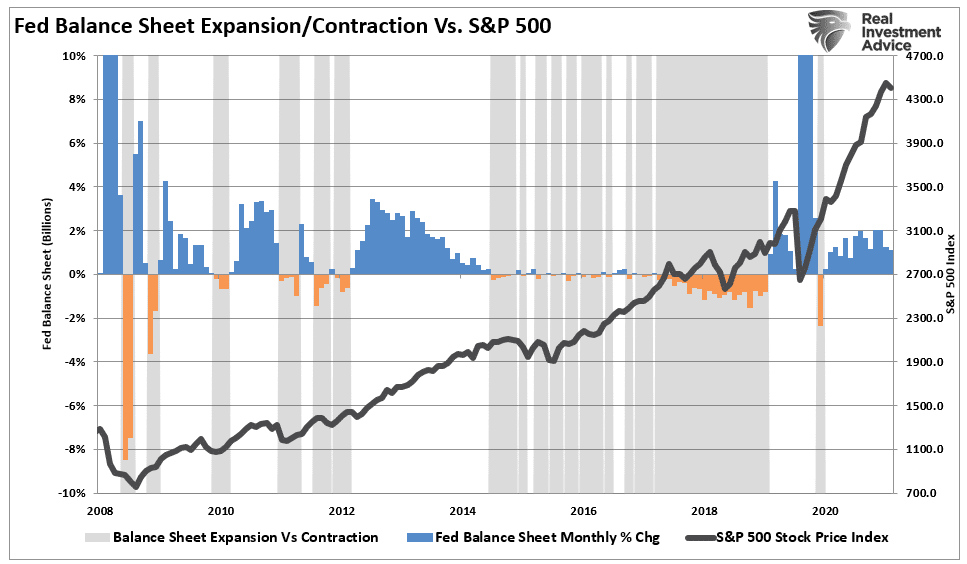
Notably, the period from the initial tapering of assets and a market correction is almost immediate.
So far, the Fed is only TALKING about taper. November, however, could be a different story.
Fed Rate Hikes (Not Yet)
The risk of a market correction rises further when the Fed is tapering its balance sheet and increasing the overnight lending rate. Currently, there is no expectation for rate hikes until late 2022.

What we now know, after more than a decade of experience, is that when the Fed starts to slow or drain its monetary liquidity, the clock starts ticking to the next corrective cycle.
Once the Fed begins to hike interest rates, market corrections occur quickly, generally within 2-4 quarters. However, recessions and bear markets typically take longer and have been extended due to ongoing interventions. Recent history has moved the median time frame between the first rate hike and the onset of a recession to somewhere between 24 and 36 months.
Investors have several primary indicators to follow to navigate market risk and potential bear markets. While there is currently no indication of a recession or bear market, the Fed starting to “taper” its asset purchases will increase volatility.
Once the Fed begins to hike rates or yield curves start to invert, the time to become much more defensive will become evident.
However, such could all change quickly with the introduction of an exogenous event.
In the meantime, remain invested but don’t be lulled into complacency.
Changes in markets always happen slowly, then all at once.

Portfolio Update
As noted above, we discussed taking profits, increasing duration in our bond portfolios, and holding extra cash during the last several weeks. Such was to reduce our portfolio risk in advance of a market decline.
With that short-term correction now complete, we began putting some of that extra cash to work, increasing our equity exposure from 52% to 57%. As shown below, we increased our weight to utilities, real estate, financials, and technology.

Do we still think there is a longer-term risk to the markets? Absolutely.
However, as discussed many times, our job is to take advantage of markets when a reasonable risk/reward opportunity presents itself. Therefore, we can take advantage of those short-term opportunities without sacrificing our risk management strategies.
Our clients need us to create returns opportunistically to attain their financial goals. As discussed in “Picking Up Pennies:”
“Our job is to participate in the markets with a bias toward capital preservation. As noted, the destruction of capital during market declines has the most significant impact on long-term portfolio performance.”
There is little denying we are in a strongly trending bull market, driven by massive amounts of exuberance and liquidity. As such, we have to keep managing our portfolios for “what is” rather than “what we think it should be.”
I do understand there is a significant risk. Or, as Seth Klarman from Baupost Capital once stated:
“Can we say when it will end? No. Can we say that it will end? Yes. And when it ends and the trend reverses, here is what we can say for sure. Few will be ready. Few will be prepared.”
We are not in the “prediction business.”
We are in the “risk management business.”
Have a great weekend.
By Lance Roberts, CIO
Market & Sector Analysis
Analysis & Stock Screens Exclusively For RIAPro Members
S&P 500 Tear Sheet
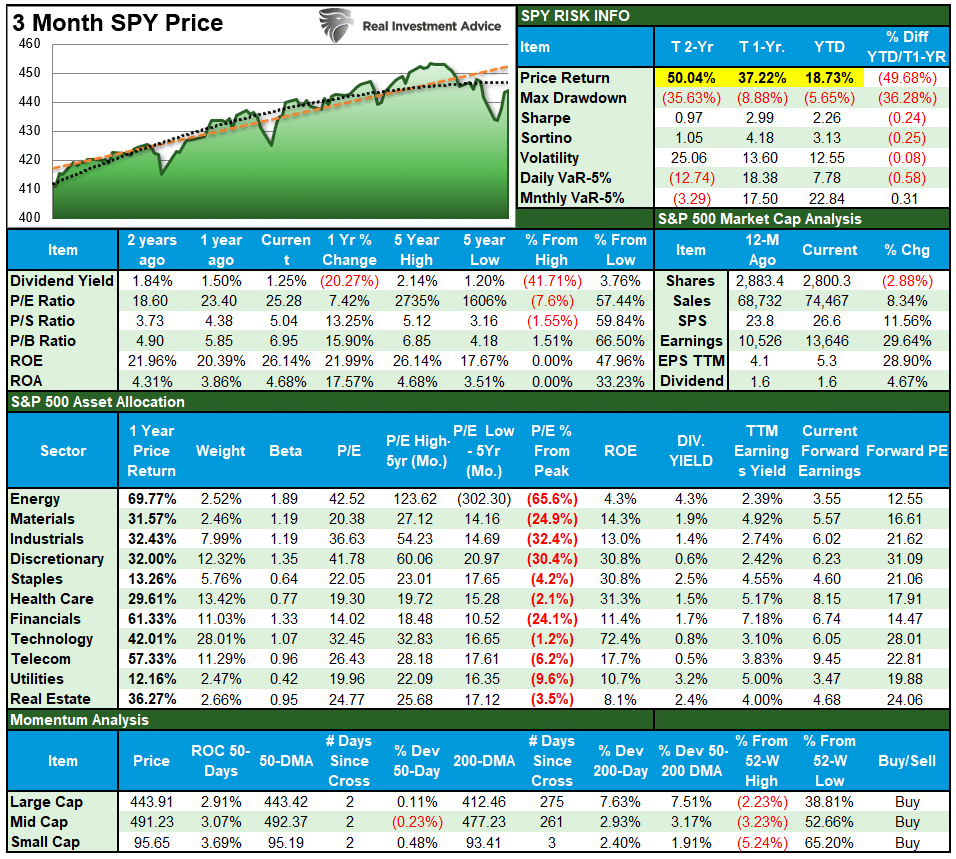
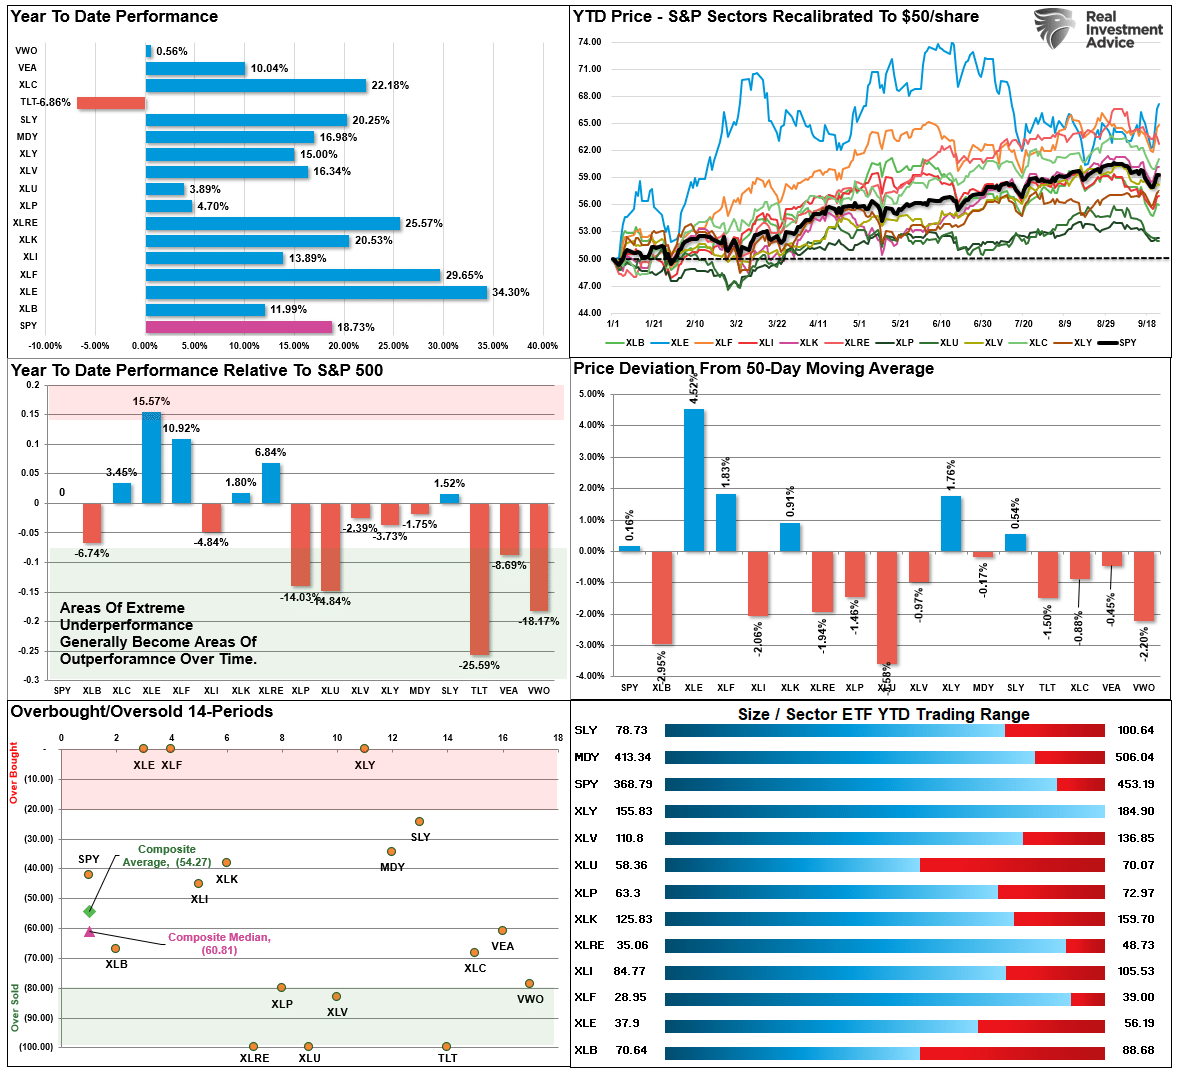
Performance Analysis
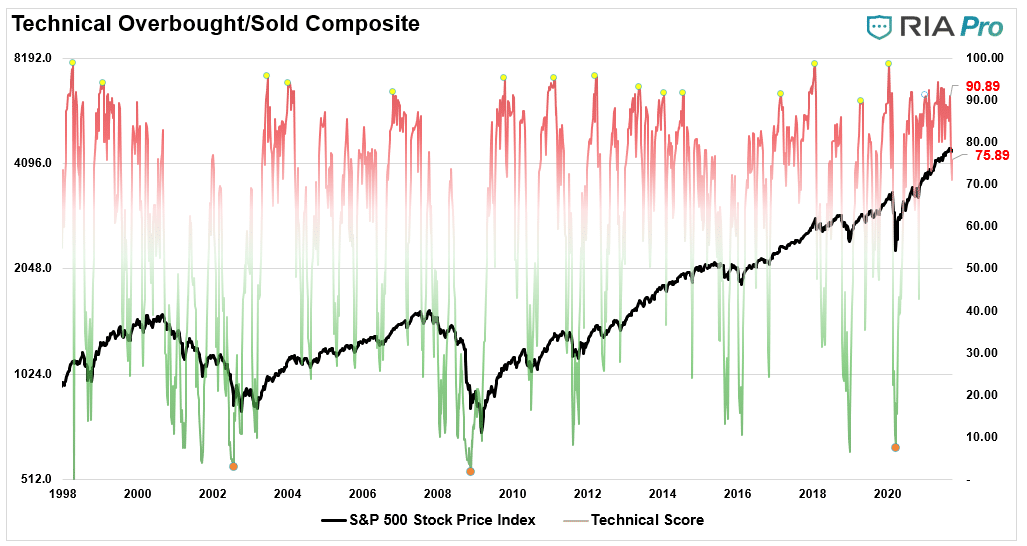
Technical Composite
The technical overbought/sold gauge comprises several price indicators (RSI, Williams %R, etc.), measured using “weekly” closing price data. Readings above “80” are considered overbought, and below “20” are oversold. The current reading is 75.89 out of a possible 100.
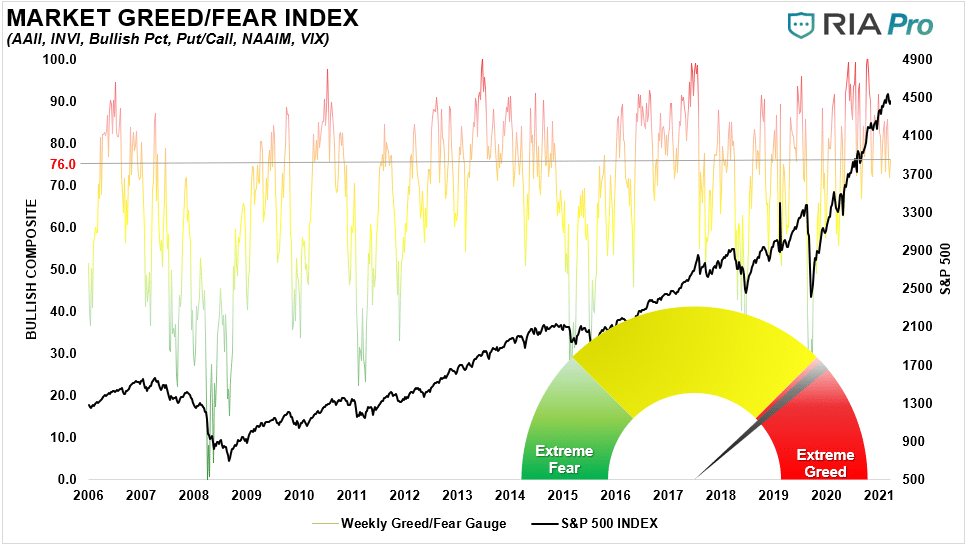
Portfolio Positioning “Fear / Greed” Gauge
Our “Fear/Greed” gauge is how individual and professional investors are “positioning” themselves in the market based on their equity exposure. From a contrarian position, the higher the allocation to equities, to more likely the market is closer to a correction than not. The gauge uses weekly closing data.
NOTE: The Fear/Greed Index measures risk from 0-100. It is a rarity that it reaches levels above 90. The current reading is 76.0 out of a possible 100.
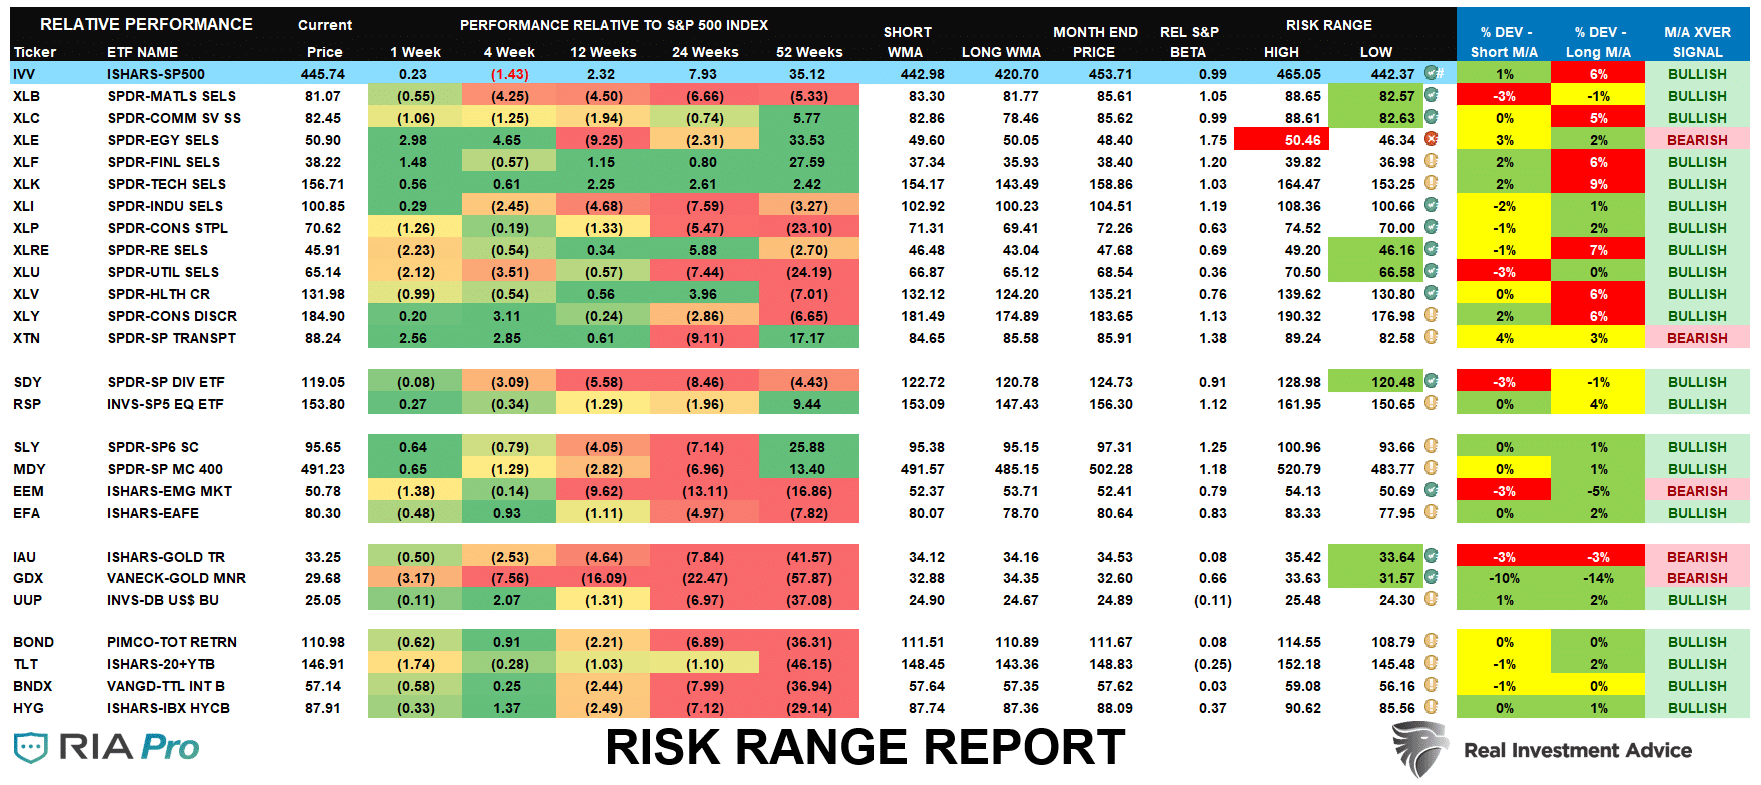
Sector Model Analysis & Risk Ranges
How To Read This Table
- The table compares each sector and market to the S&P 500 index on relative performance.
- “MA XVER” is determined by whether the short-term weekly moving average crosses positively or negatively with the long-term weekly moving average.
- The risk range is a function of the month-end closing price and the “beta” of the sector or market. (Ranges reset on the 1st of each month)
- Table shows the price deviation above and below the weekly moving averages.
Weekly Stock Screens
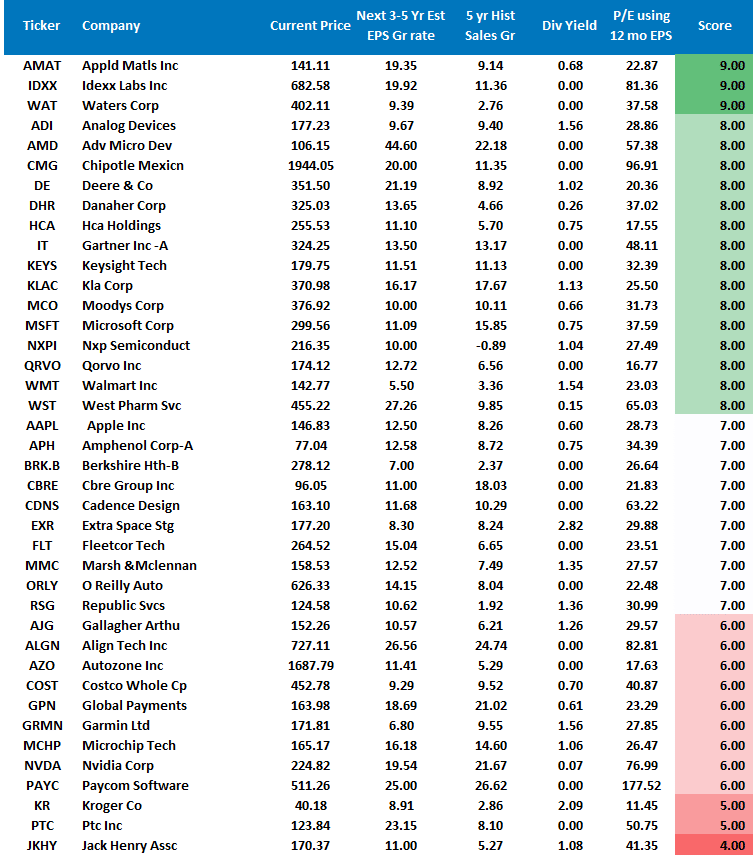
Currently, there are four different stock screens for you to review. The first is S&P 500 based companies with a “Growth” focus, the second is a “Value” screen on the entire universe of stocks, and the last are stocks that are “Technically” strong and breaking above their respective 50-dma.
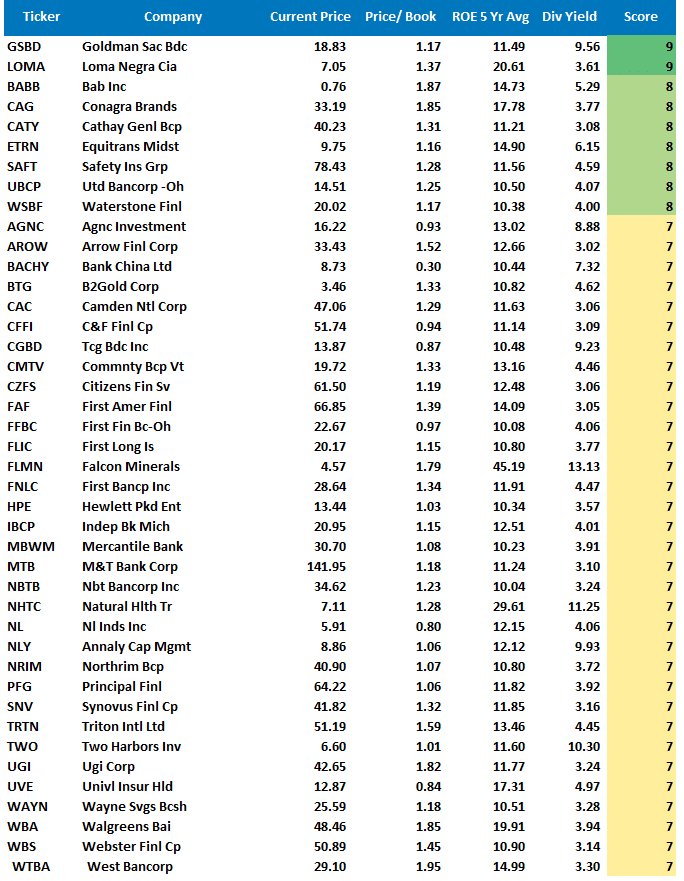
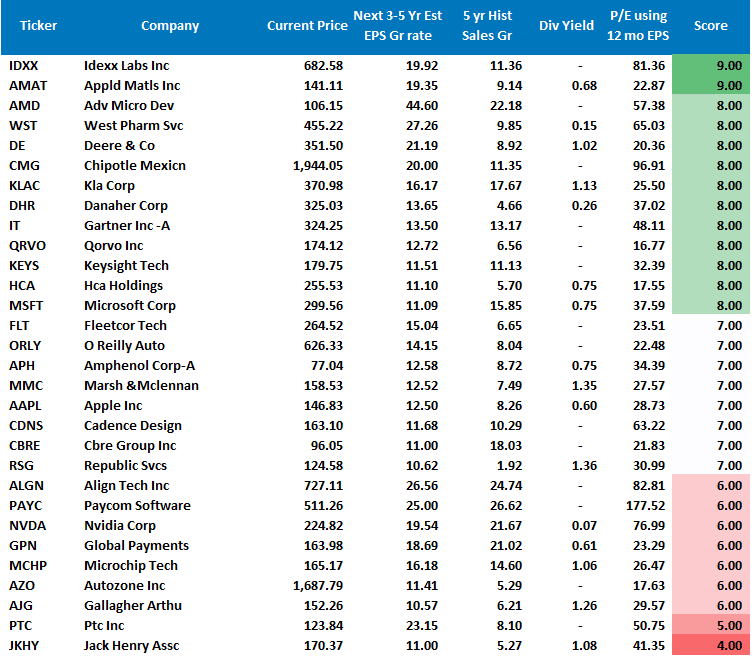
We have provided the yield of each security and a Piotroski Score ranking to help you find fundamentally strong companies on each screen. (For more on the Piotroski Score – read this report.)
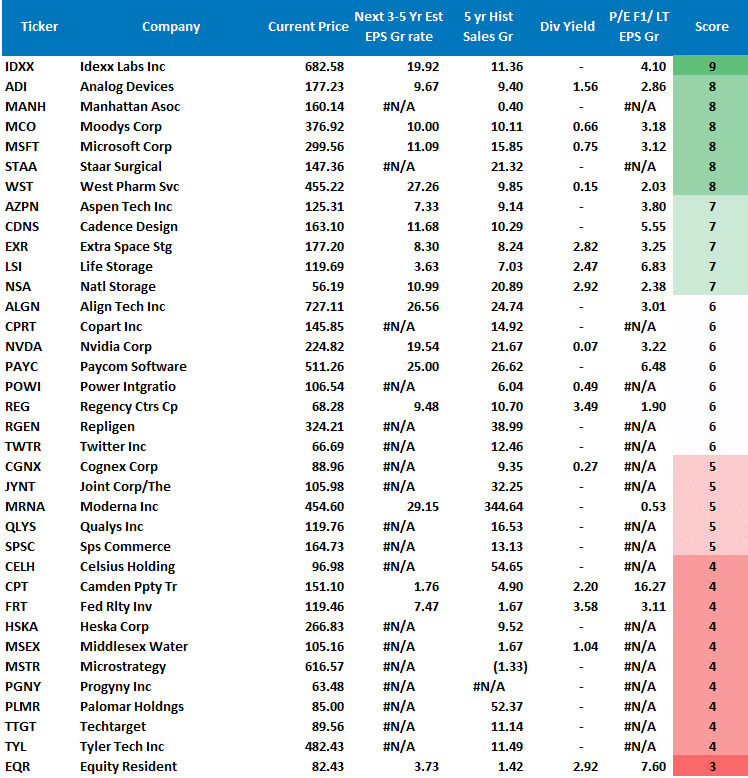
S&P 500 Growth Screen
Low P/B, High-Value Score, High Dividend Screen
Fundamental Growth Screen
Aggressive Growth Strategy
Portfolio / Client Update
Finally, after weeks of warning about it, the market completed a 5% correction from peak to trough. As noted last week, the good news is the portfolio models withstood correction with minor damage. As discussed below, we are now using our increased cash levels to buy into holdings we trimmed back previously.
With the Federal Reserve announcement now behind us, and markets regaining the 50-dma, the market is set to regain previous levels over the next week. Thus, with the last quarter of the year approaching, bias should remain to the upside, although somewhat limited.
High valuations and slowing earnings growth will likely put a cap on the market’s advance through year-end. As such, we will likely become a bit more proactive in trimming gains, and harvesting losses, to prepare portfolios for potential rate hikes in 2022.
For now, there seems to be a reduced risk in the market with the Fed remaining accommodative. The one thing we can not hedge for is an exogenous event which is always a risk. However, we are confident our portfolio can withstand an initial shock which will provide the time necessary for us to derisk as needed.
We continue to monitor our portfolios closely. However, if you have any questions, do not hesitate to contact us.
Portfolio Changes
During the past week, we made minor changes to portfolios. In addition, we post all trades in real-time at RIAPRO.NET.
*** Trading Update – Equity and Sector Models ***
“The Federal Reserve did exactly as expected yesterday and threaded the needle well on putting “taper on the table” and assuring markets the ‘punch bowl’ wasn’t being taken away just yet.
With stocks deeply oversold on a short-term basis, as noted yesterday, and the threat of “taper” largely baked into the recent decline, there is a decent entry point for traders to add exposure near term.” – 09/23/21
Equity Model:
- Add 1% to GS and MSFT bring exposure to 2% each.
- Add 1% to GOOG bring model exposure to 3%. (It is 4% in equity portfolio due to price of shares.)
ETF Model
- Add 1% to XLF bringing exposure to 3%
- Add 2% to XLK bringing exposure to 10.5%.
“After finally getting a bit of a sell-off to work off the overbought condition, we are beginning to look for opportunities to increase equity exposures in portfolios as we head into year-end.
With this backdrop we are beginning to add exposure to portfolios starting with defensive positioning first, to hedge against short-term volatility, and then we will move into more momentum names as markets improve.” – 09/21/21
Equity Model:
- Add 1% to NEE bringing exposure to 2%
- Add 1% to PSA bringing exposure to 2%
ETF Model
- Add 1% to XLU bringing exposure to 3%
- Add 1% to XLRE bringing exposure to 3%.
As always, our short-term concern remains the protection of your portfolio. Accordingly, we remain focused on the differentials between underlying fundamentals and market over-valuations.
Lance Roberts, CIO
THE REAL 401k PLAN MANAGER
A Conservative Strategy For Long-Term Investors

Attention: In the next couple of weeks, the 401k plan manager will no longer appear in the newsletter. However, the link to the website will remain for your convenience. Be sure to bookmark it in your browser.
Commentary
From peak to trough, the market declined by 5%. However, as we discussed previously, such a correction is within the norms for any given market year. However, since we remain in a+ very low volatility market this year, we warned the correction would “feel” worse than it was.
Gauging by the number of emails I received, I can assume I was correct.
With the correction complete, and markets very oversold short-term, portfolio allocations can remain at current levels. Cash that accumulated over the past few weeks can now get deployed to allocations. Also, rebalance your bonds back to weightings after the recent rise in rates.
There is no need to be aggressive here. There is likely not a lot of upside between now and the end of the year.
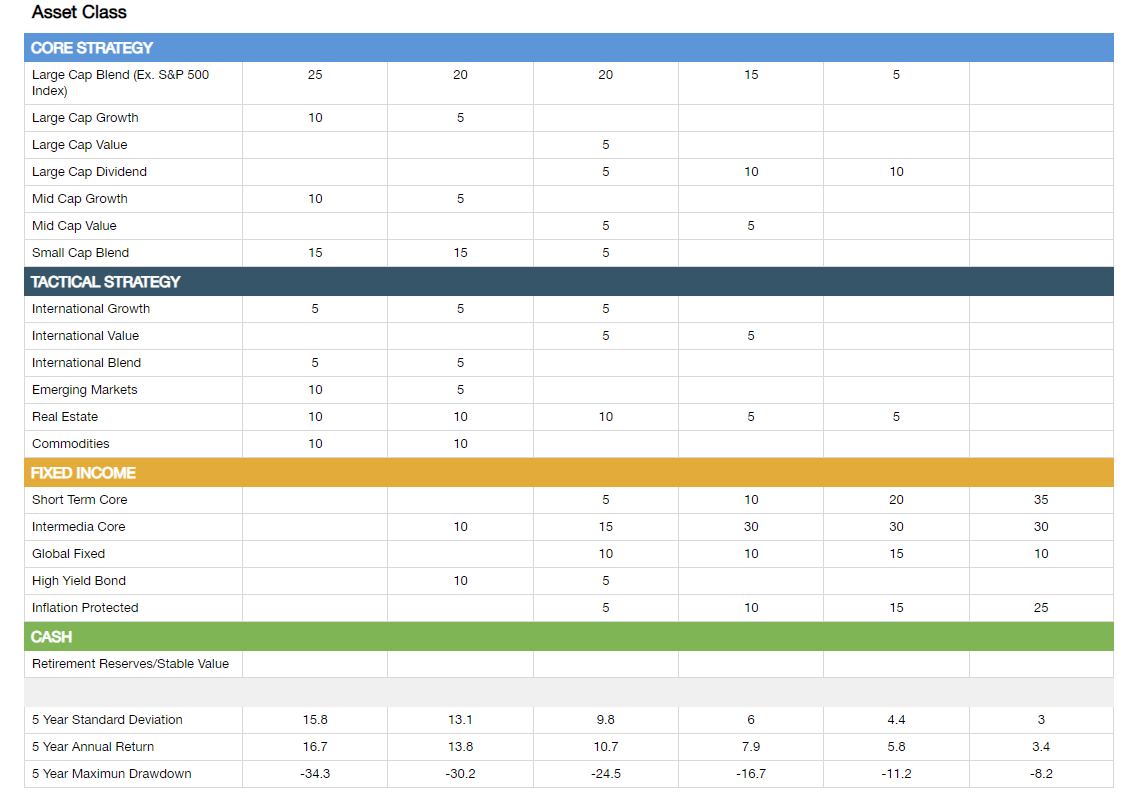
Model Descriptions
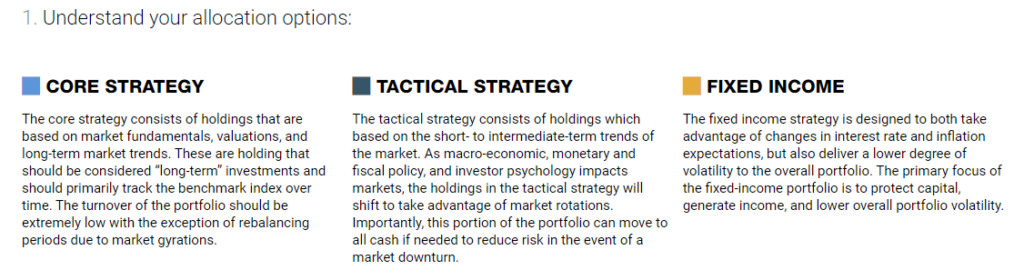
Choose The Model That FIts Your Goals
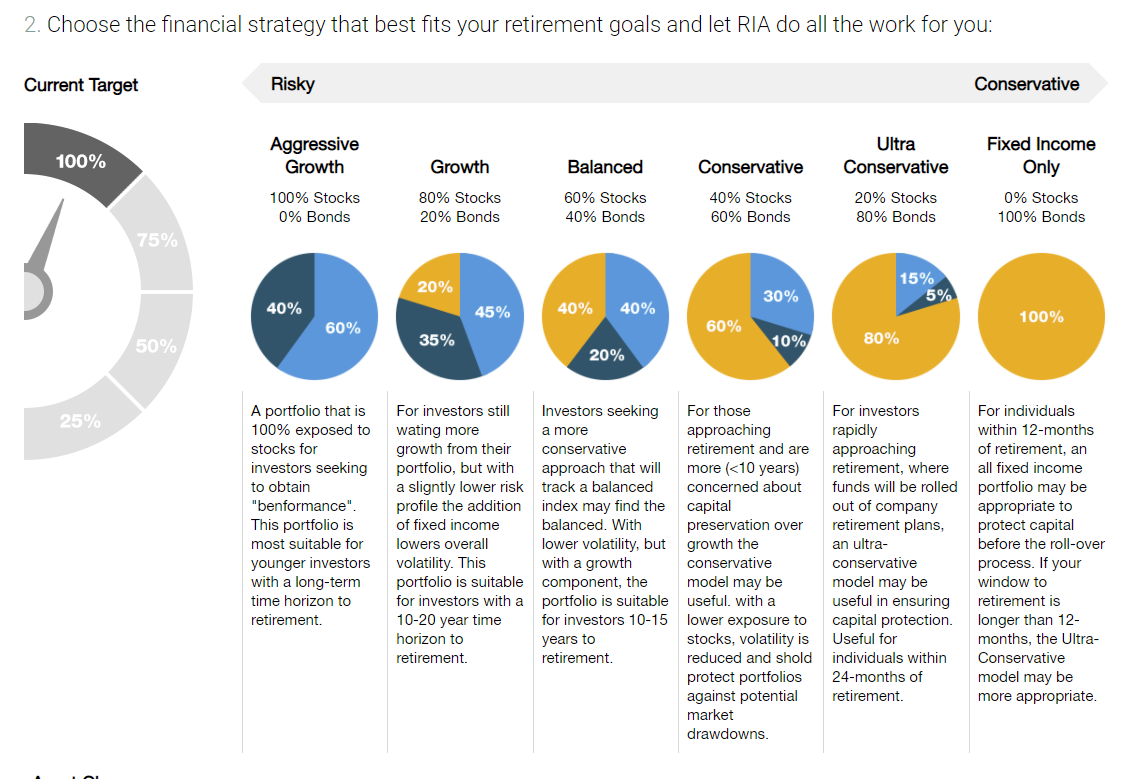
Model Allocations
If you need help after reading the alert, do not hesitate to contact me.
Or, let us manage it for you automatically.

401k Model Performance Analysis
Model performance is a two-asset model of stocks and bonds relative to the weighting changes made each week in the newsletter. Such is strictly for informational and educational purposes only, and one should not rely on it for any reason. Past performance is not a guarantee of future results. Use at your own risk and peril.

Have a great week!


Lance Roberts is a Chief Portfolio Strategist/Economist for RIA Advisors. He is also the host of “The Lance Roberts Podcast” and Chief Editor of the “Real Investment Advice” website and author of “Real Investment Daily” blog and “Real Investment Report“. Follow Lance on Facebook, Twitter, Linked-In and YouTube
Customer Relationship Summary (Form CRS)
Also Read


