Charting the stock market “melt-up” in prices, and the Fed’s naivety of the laws of physics may be of benefit to younger investors. After more than a decade of rising prices, accelerating markets seem entirely normal, detached from underlying fundamentals. As a result, new acronyms like “TINA” and “BTFD” get developed to rationalize surging prices.
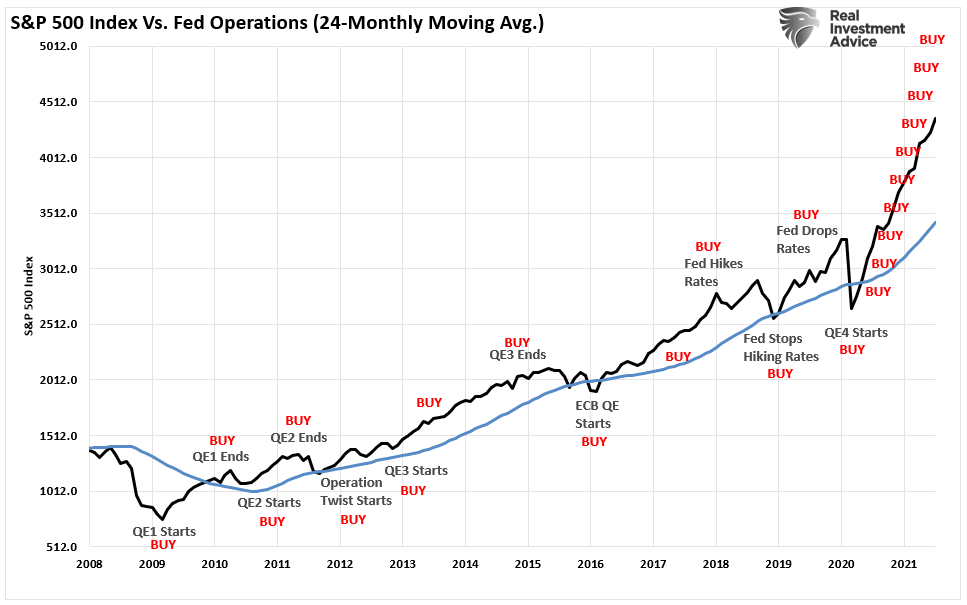
However, a more extended look at price history suggests the current market environment is anything but typical. More importantly, the “moral hazard” created by the Federal Reserve’s continuous bailouts have put individual investors at significant risk.

A Long History Of Poor Outcomes
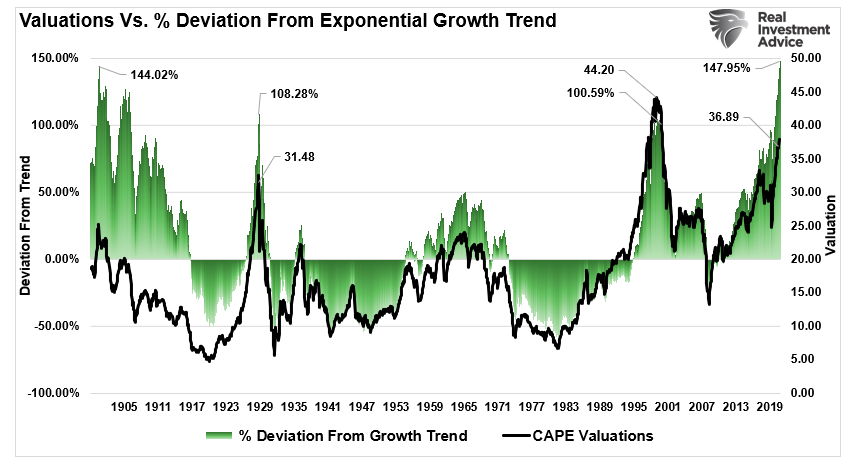
In the short term, like above, charting stock market prices may not seem extraordinarily stretched. However, this is because the chart lacks context from a historical perspective. Once we look at the market from 1900 to the present, a different picture emerges compared to its exponential long-term growth trend.
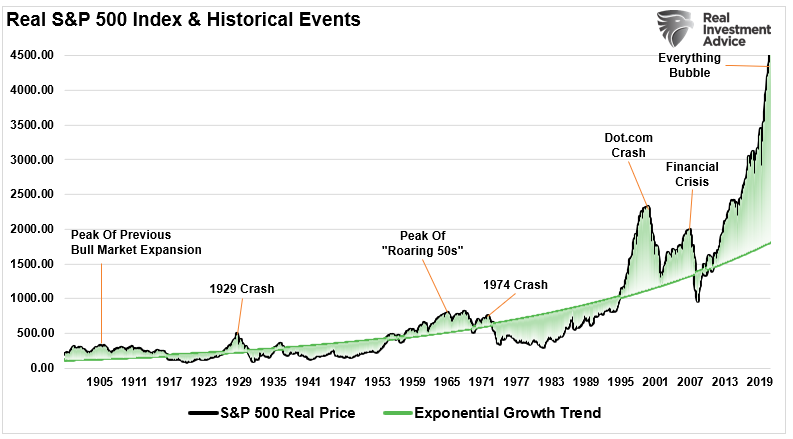
Usually, when charting long-term stock market prices, I would use a log-scale to minimize the impact of large numbers on the whole. However, in this instance, such is not appropriate as we examine the historical deviations from the underlying growth trend.
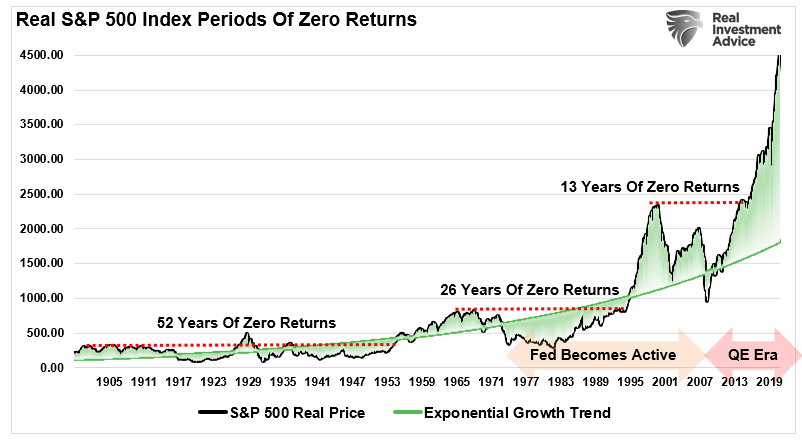
What you should take away from the chart above is apparent. Investing capital when prices are exceedingly above the underlying growth trend repeatedly had poor outcomes. Investing money at peak deviations led to very long periods of ZERO returns on capital. (Interestingly, as the Fed became active in the markets, the periods of zero returns got cut in half.)
Timing Is Everything
Investors are remiss to dismiss the importance of the long periods of zero returns.
More often than not, the consistently bullish advisory and media crowd present long-term studies to support investing in markets. Generally, these studies get presented without context to coerce you into buying their products or using their services. I recently showed an example of such a study:
While well-meaning, there are several critical points with such analysis. Let’s review the long-term chart above.
- When charting stock market prices or returns, cherry-picked start dates can provide any result you want.
- For example, 100-years ago was 1920. That was the beginning of a significant bull market cycle that lasted until 1929.
- However, back up 20-years to 1900, an investor had to wait until the 1950s to break even.
- Starting 25-years ago was 1995. While the run from 1995-2000 was solid, investors spent the next 13-years going nowhere.
Given that we don’t live forever and have a finite time frame to save for retirement, “when” you start your investing journey is critically important.
As the old saying goes, “timing is everything.”

Newton’s Law Of Gravity
Sir Issac Newton discovered the relationship between the motion of the moon and the motion of a body falling freely on Earth. His dynamical and gravitational theories established the modern quantitative science of gravitation. Moreover, Newton realized that this force could be, at long range, the same as the force with which Earth pulls objects on its surface downward.
Notably, there is a clear “gravitational pull” of prices to the exponential growth trend line. Thus, without fail, when prices have deviated well above the trend line, there was an eventual reversion below the trend.
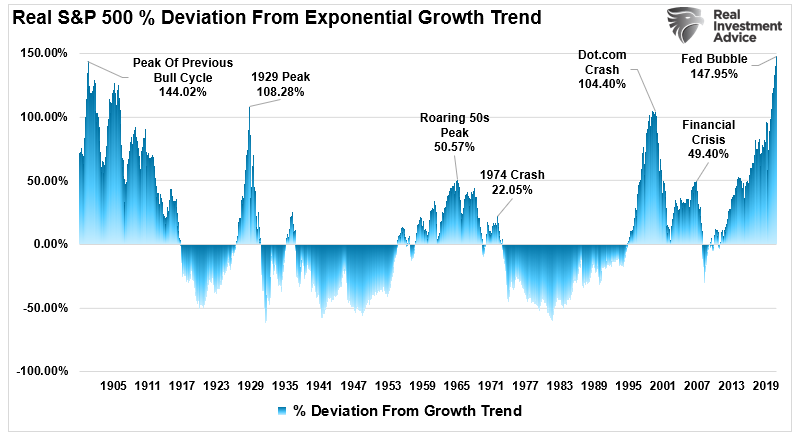
Since the Federal Reserve became active with “monetary interventions” in 2009, the current deviation from the long-term trend is the highest in history. Of course, as one would expect, valuation excesses accompany such deviations.
In all cases, the subsequent returns to investors from such excesses in price and valuation have never been kind.
Ignoring The Laws Of Physics
Interestingly, in the July FOMC minutes, the Fed made mention of market valuations. However, while they may acknowledge that valuations have become elevated, they fail to understand the laws of physics.
As noted, extreme deviations above the long-term growth trend will eventually revert to the mean. In the 60s and 70s, it took nearly 15-years of rolling tops and bear markets to complete the reversion. It took almost 9-years to complete the reversion at the turn of the century.
The problem facing the Fed is the diminishing impact of QE on the financial markets. As noted previously, it requires ever greater levels of monetary intervention to lift asset prices. As a result, when the reversion to mean ultimately begins, the Fed may not be able to arrest the decline as quickly as they did in 2020.
There is more than adequate evidence a “bubble” exists in markets once again.
‘I have no idea whether the stock market is actually forming a bubble that’s about to break. But I do know that many bulls are fooling themselves when they think a bubble can’t happen when there is such widespread concern. In fact, one of the distinguishing characteristics of a bubble is just that.
“It’s important for all of us to be aware of this bubble psychology, but especially if you’re a retiree or a near-retiree. That’s because, in that case, your investment horizon is far shorter than for those who are younger. Therefore, you are less able to recover from the deflation of a market bubble.” – Mark Hulbert
Read that statement again.
Millennials are quick to dismiss the “Boomers” in the financial markets today for “not getting it.”
No, we get it. We have just been around long enough to know how these things eventually end.

When The Money Runs Out
Historically, all market crashes have been the result of things unrelated to valuation levels. Instead, issues such as liquidity, government actions, monetary policy mistakes, recessions, or inflationary spikes are the culprits that trigger the “reversion in sentiment.”
Notably, the “bubbles” and “busts” are never the same.
I previously quoted Bob Bronson on this point:
“It can be most reasonably assumed that markets are efficient enough that every bubble is significantly different than the previous one. A new bubble will always be different from the previous one(s). Such is since investors will only bid prices to extreme overvaluation levels if they are sure it is not repeating what led to the previous bubbles. Comparing the current extreme overvaluation to the dotcom is intellectually silly.
I would argue that when comparisons to previous bubbles become most popular, it’s a reliable timing marker of the top in a current bubble. As an analogy, no matter how thoroughly a fatal car crash is studied, there will still be other fatal car crashes. Such is true even if we avoid all previous accident-causing mistakes.”
Comparing the current market to any previous period in the market is rather pointless. The current market is not like 1995, 1999, or 2007? Valuations, economics, drivers, etc., are all different from one cycle to the next.
Most importantly, however, the financial markets constantly adapt to the cause of the previous “fatal crash.”
Unfortunately, that adaptation won’t prevent the next one.
Yes, this time is different.
“Like all bubbles, it ends when the money runs out.” – Andy Kessler


Lance Roberts is a Chief Portfolio Strategist/Economist for RIA Advisors. He is also the host of “The Lance Roberts Podcast” and Chief Editor of the “Real Investment Advice” website and author of “Real Investment Daily” blog and “Real Investment Report“. Follow Lance on Facebook, Twitter, Linked-In and YouTube
Customer Relationship Summary (Form CRS)
Also Read