


J. Brett Freeze and his firm Global Technical Analysis (GTA) provides RIA Pro subscribers Cartography Corner on a monthly basis. Brett’s analysis offers readers a truly unique brand of technical insight and risk framework. We personally rely on Brett’s research to help better gauge market trends, their durability, and support and resistance price levels.
GTA presents their monthly analysis on a wide range of asset classes, indices, and securities. At times the analysis may agree with RIA Pro technical opinions, and other times it will run contrary to our thoughts. Our goal is not to push a single view or opinion, but provide research to help you better understand the markets. Please contact us with any questions or comments. If you are interested in learning more about GTA’s services, please connect with them through the links provided in the article.
The link below penned by GTA provides a user’s guide and a sample of his analysis.
The Cartography Corner
November 2021
By: J. Brett Freeze, CFA
October 2021 Review
E-Mini S&P 500 Futures
We begin with a review of E-Mini S&P 500 Futures (ESZ1) during October 2021. In our October 2021 edition of The Cartography Corner, we wrote the following:
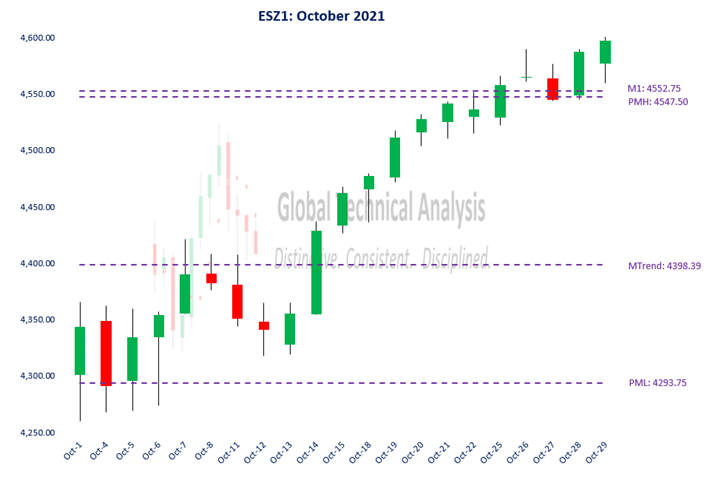
In isolation, monthly support and resistance levels for October are:
o M4 4747.25
o M1 4552.75
o PMH 4547.50
o MTrend 4398.39
o Close 4297.75
o PML 4293.75
o M2 4239.75
o M3 4075.00
o M5 4045.25
Active traders can use MTrend: 4398.39 as the pivot, maintaining a long position above that level and a flat or short position below it.
Figure 1 below displays the daily price action for October 2021 in a candlestick chart, with support and resistance levels isolated by our methodology represented as dashed lines. The option tail wagged the dog again. Like what occurred in June, July, and August, the market put in a local high on October 7th (the fifth trading session) and then declined over the next three trading sessions by (2.36%), high-to-low. Our isolated pivot at MTrend: 4398.39 essentially capped this early rally, as the market price did not settle above it.
On October 13th and 14th, the market price rallied 2.59% from the previous low and settled above our isolated pivot at MTrend: 4398.39. It never looked back. The remainder of October saw the market price rise to, and exceed, our clustered resistance levels at PMH: 4547.50 / M1: 4552.75.
Conservatively, active traders following our analysis realized a profit of 2.79%.
Figure 1:
Bitcoin
We continue with a review of Bitcoin Futures (BTX1) during October 2021. In our October 2021 edition of The Cartography Corner, we wrote the following:
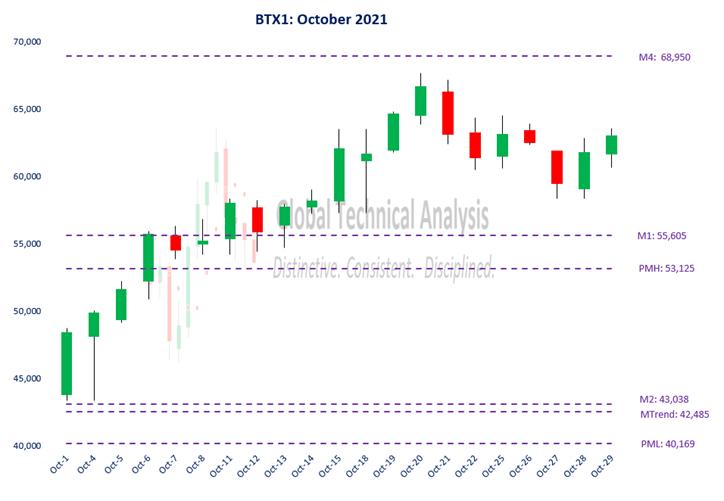
In isolation, monthly support and resistance levels for October are:
o M4 68,950
o M1 55,605
o PMH 53,125
o Close 43,615
o M2 43,038
o MTrend 42,485
o PML 40,169
o M3 39,840
o M5 29,693
Active traders can use MTrend: 42,485 as the initial pivot, maintaining a long position above that level and a flat or short position below it.
Figure 2 below displays the daily price action for October 2021 in a candlestick chart, with support and resistance levels isolated by our methodology represented as dashed lines. The first four trading sessions in October saw the market price ascend to 55,700, just above our isolated resistance level at M1: 55,605. The market price consolidated around this level for the following five trading sessions, building energy for its next directional move.
Starting on October 13th, and accelerating on the 14th, the market price began its run towards our isolated Upside Exhaustion level at M4: 68,950. Curiously, those dates are the same dates that the S&P 500 started it’s run higher. Coordinated ‘Risk-On’ acceleration. The market price reached its high on October 20th at 67,680, just 1.8 % shy of M4: 68,950. Our analysis captured 98.2% of the realized range.
Figure 2:
November 2021 Analysis
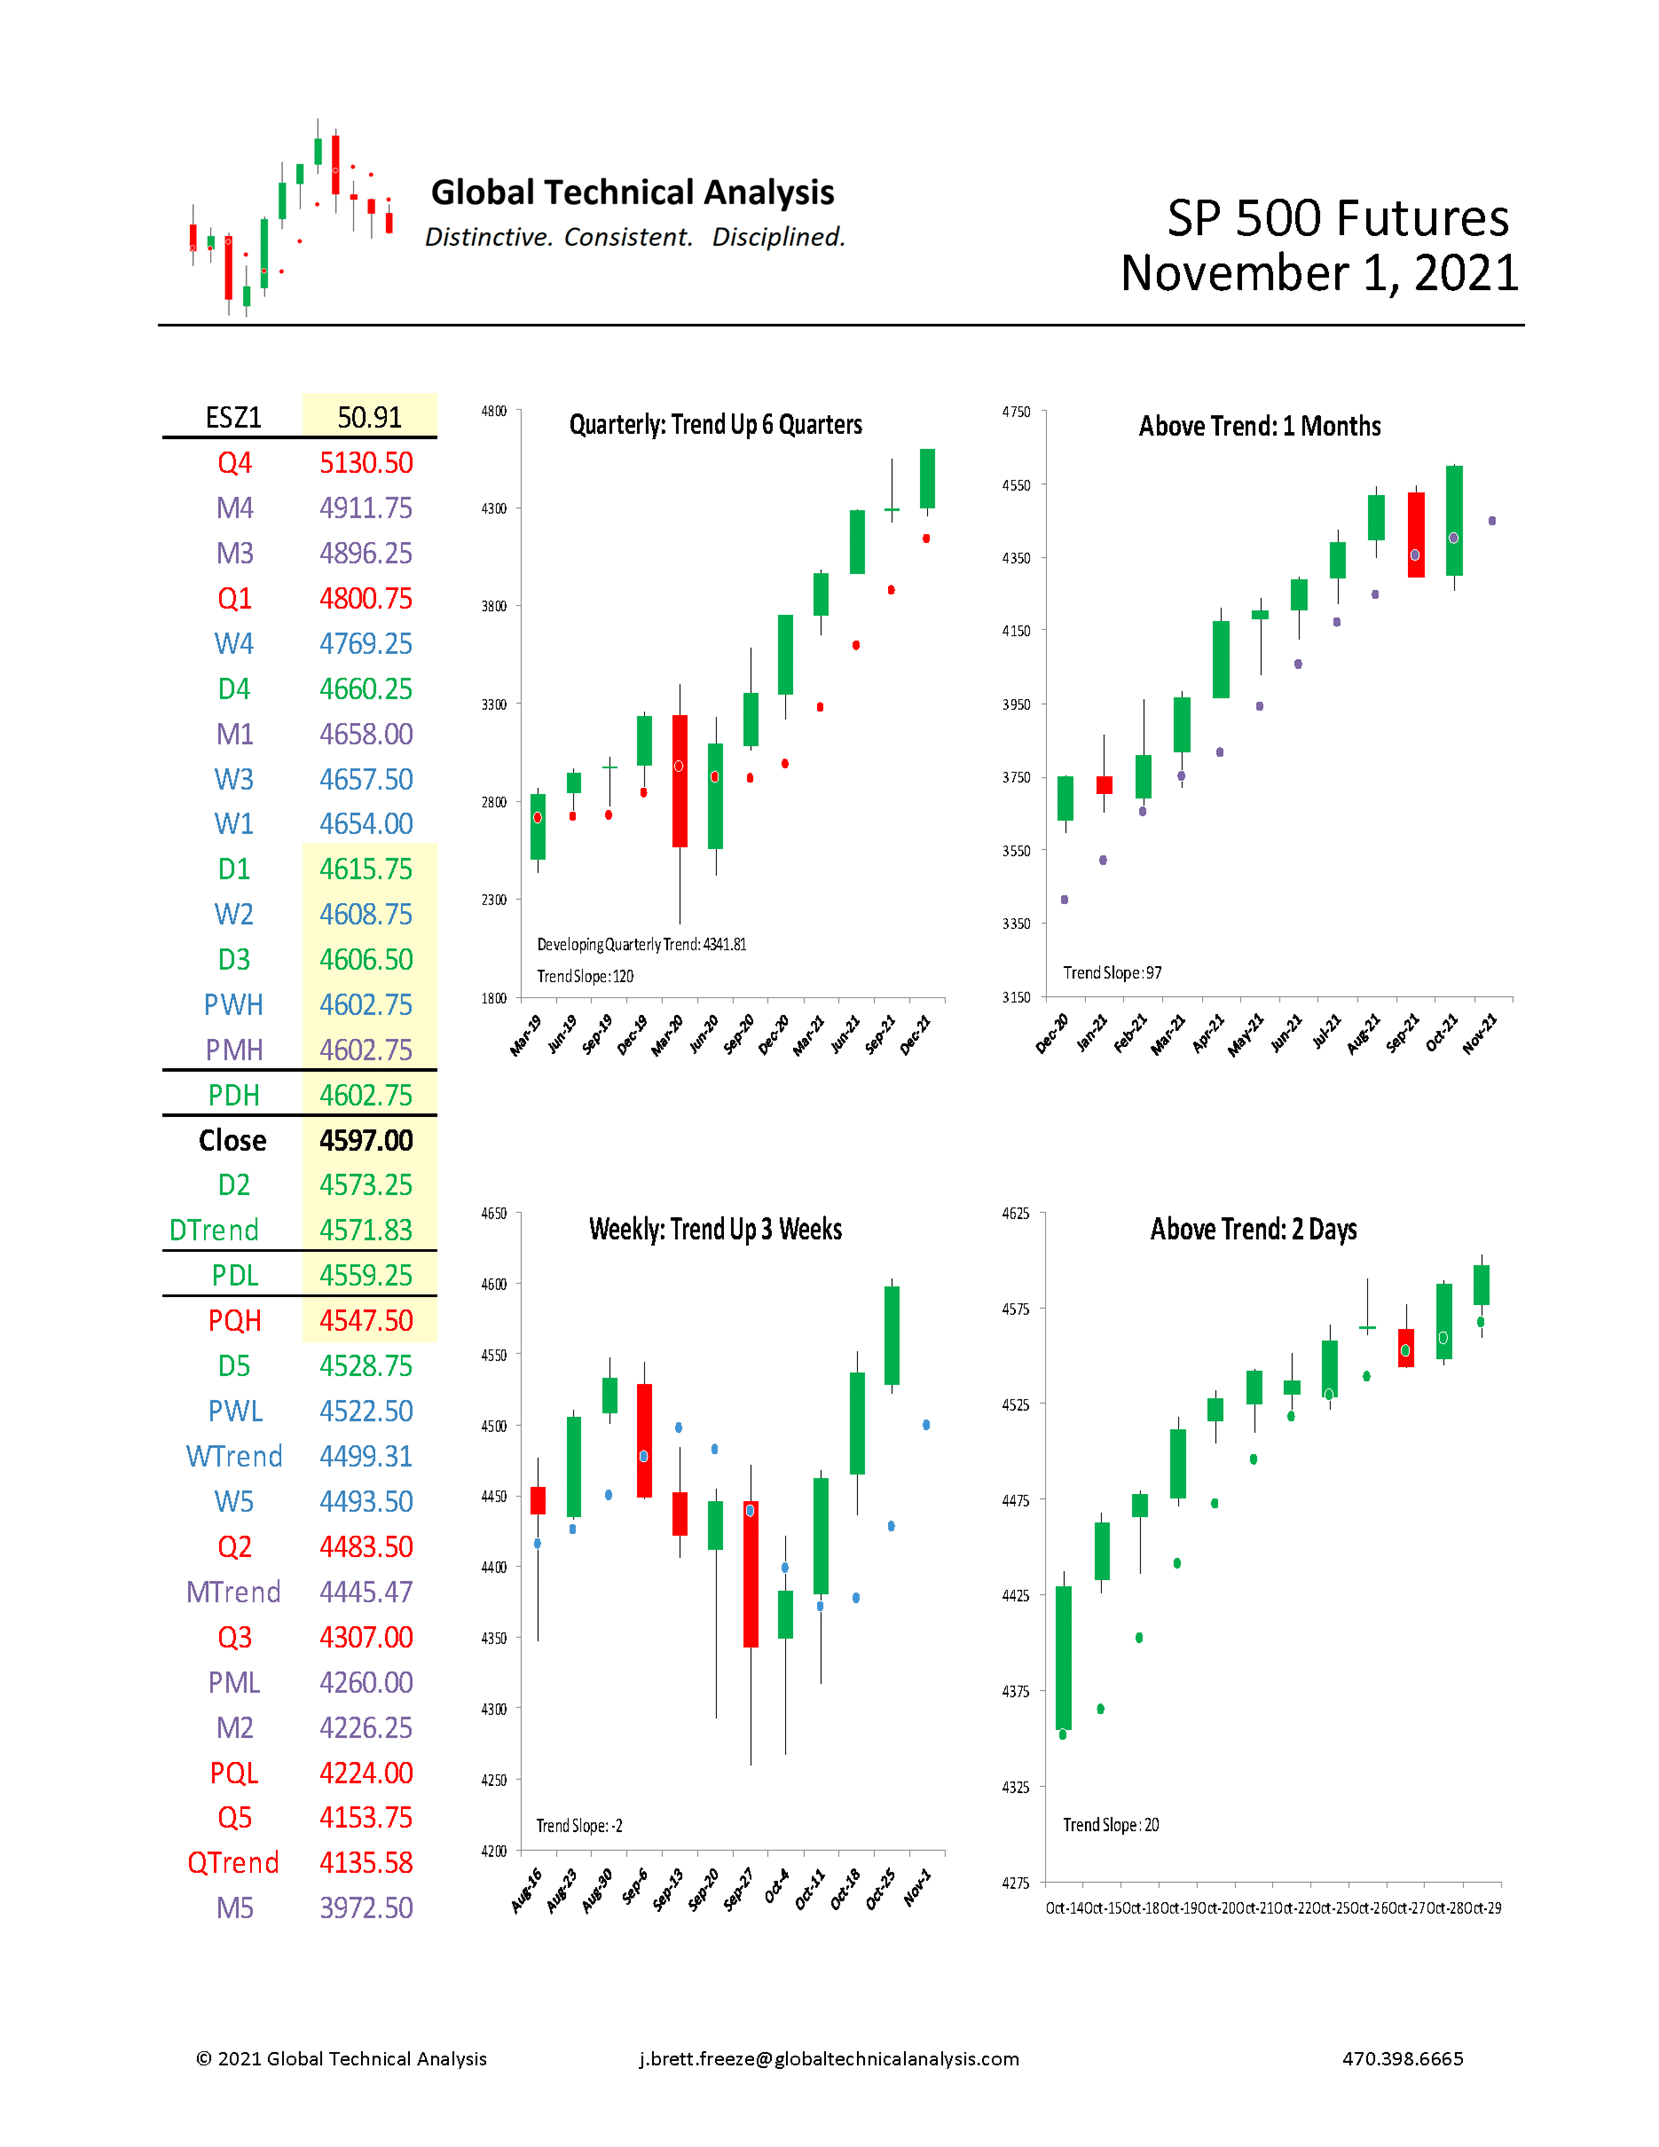
We begin by providing a monthly time-period analysis of E-Mini S&P 500 Futures (ESZ1). The same analysis can be completed for any time-period or in aggregate.
Trends:
o Current Settle 4597.00
o Daily Trend 4571.83
o Weekly Trend 4499.31
o Monthly Trend 4445.47
o Quarterly Trend 4135.58
The relative positioning of the Trend Levels is as bullish as possible. Think of the relative positioning of the Trend Levels like you would a moving-average cross. In the quarterly time-period, the chart shows that E-Mini S&P 500 Futures are “Trend Up”, having settled above Quarterly Trend for six quarters. Stepping down one time-period, the monthly chart shows that E-Mini S&P 500 Futures are “Above Trend: 1 Months”. Stepping down to the weekly time-period, the chart shows that E-Mini S&P 500 Futures are “Trend Up”, with three consecutive closes above Weekly Trend.
In our October edition, we asked “Is the bull market over?”. Mr. Market answered with a resounding “No”, rising 6.96% over the month. “Everest”, the 2015 movie about a deathly expedition to climb Mt. Everest, describes the current U.S. stock market which, on many valuation measures, has only rarely attained such height. Figure 3 below displays one such measure.
Figure 3:
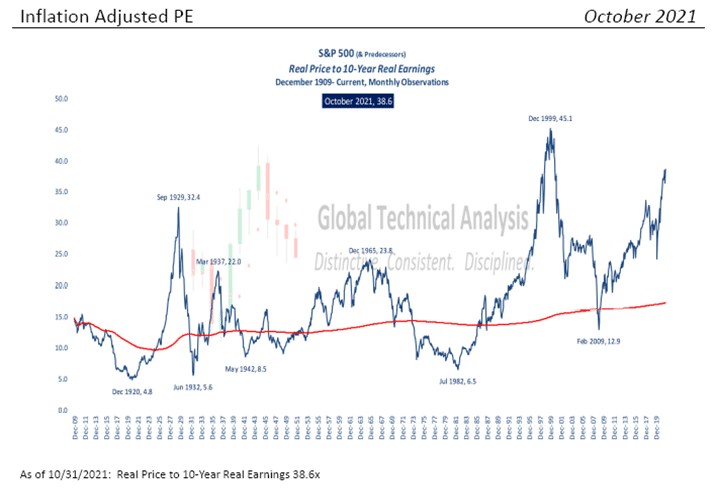
Like what the Everest climbers encountered, the descent from the summit will be fraught with both anticipated and unanticipated danger. Once begun, our analysis will be your Sherpa for that descent, just as it has on the trek up.
Support/Resistance:
In isolation, monthly support and resistance levels for November are:
o M4 4911.75
o M3 4896.25
o M1 4658.00
o PMH 4602.75
o Close 4597.00
o MTrend 4445.47
o PML 4260.00
o M2 4226.25
o M5 3972.50
Active traders can use MTrend: 4445.47 as the pivot, maintaining a long position above that level and a flat or short position below it.
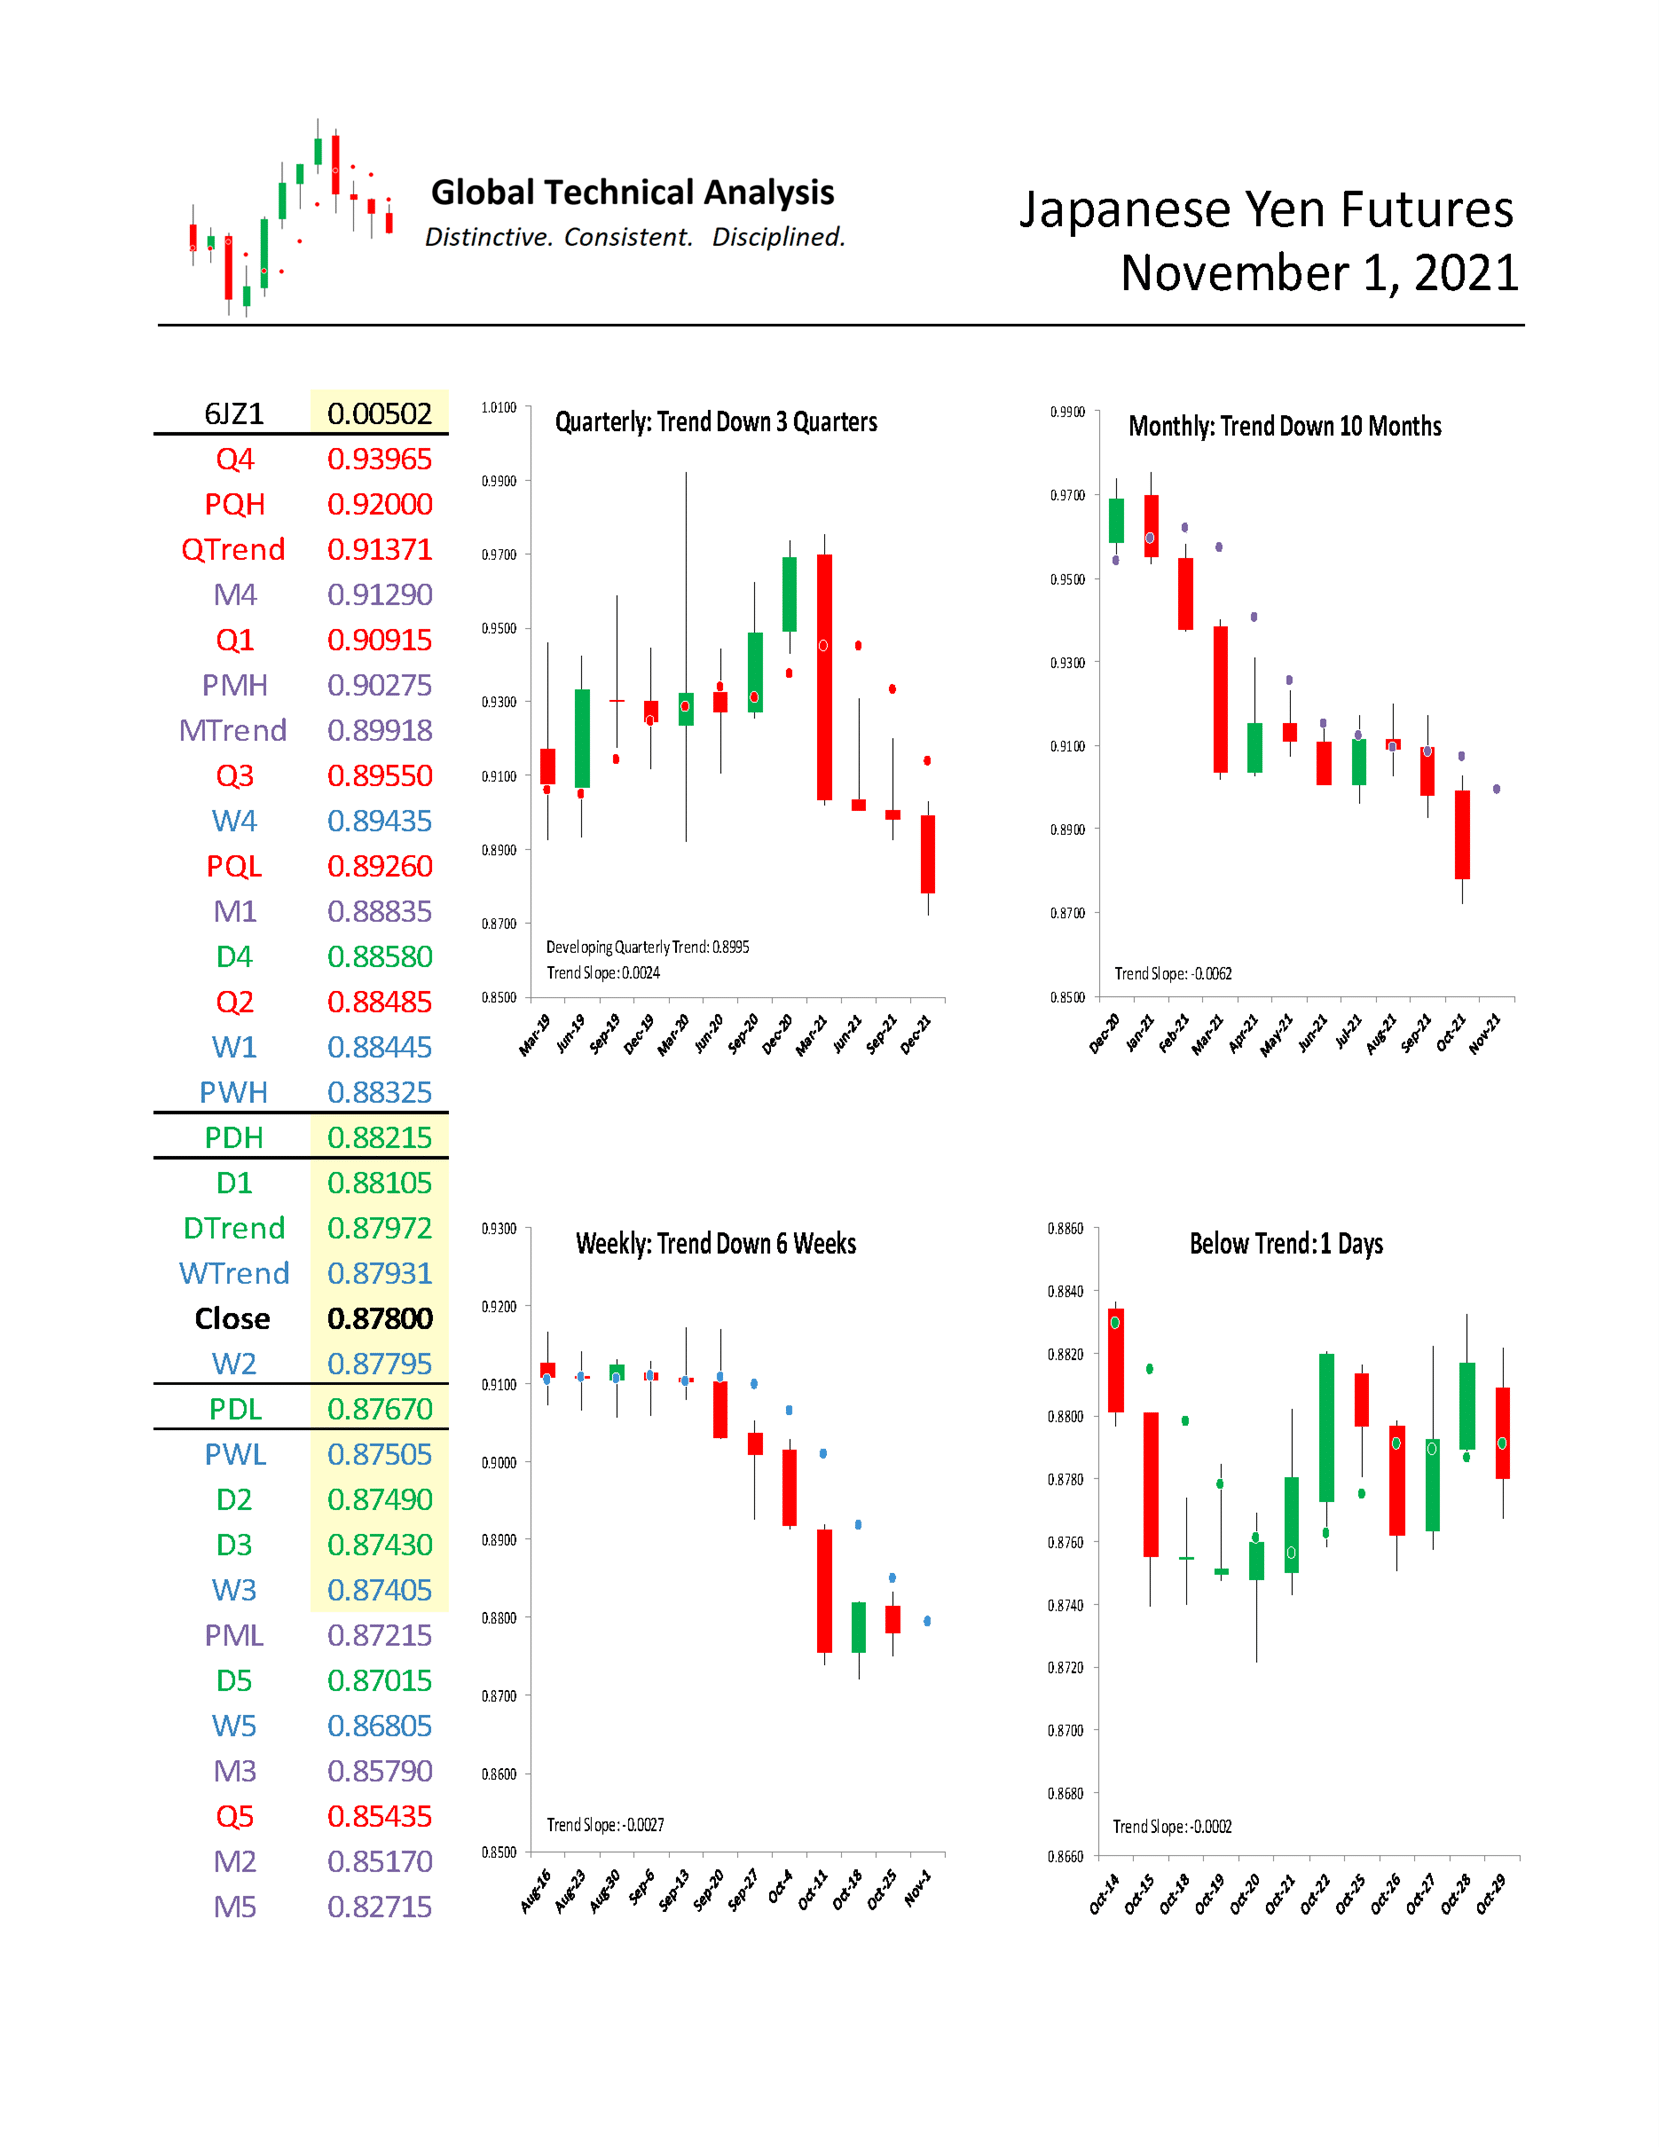
Japanese Yen Futures
For November, we focus on Japanese Yen Futures (“the yen”). We provide a monthly time-period analysis of 6JZ1. The same analysis can be completed for any time-period or in aggregate.
Trends:
o Quarterly Trend 0.91371
o Monthly Trend 0.89918
o Daily Trend 0.87972
o Weekly Trend 0.87931
o Current Settle 0.87800
The relative positioning of the Trend Levels is bearish. Think of the relative positioning of the Trend Levels like you would a moving-average cross. As can be seen in the quarterly chart below, the yen is “Trend Down”, having settled three quarters below Quarterly Trend. Stepping down one time-period, the monthly chart shows that the yen is “Trend Down”, having settled ten months below Monthly Trend. Stepping down to the weekly time-period, the chart shows that the yen is “Trend Down”, having settled below Weekly Trend for six weeks.
One rule we have is to anticipate a two-period high (low), within the following four to six periods, after a Downside (Upside) Exhaustion level has been reached. The signal was given in 1Q2021 to anticipate a two-quarter high within the next four to six quarters (now one to three). That high can be achieved this quarter with a trade above 0.930900. The signal was given the week of October 11th to anticipate a two-week high within the next four to six weeks (now one to three). That high can be achieved this week with a trade above 0.8832500.
Speculative positioning, structural momentum, and trend persistence are all in the extreme left tail of their distributions. We encourage clients to review those graphs on the website.
Support/Resistance:
In isolation, monthly support and resistance levels for November are:
o M4 0.91290
o PMH 0.90275
o MTrend 0.89918
o M1 0.88835
o Close 0.87800
o PML 0.87215
o M3 0.85790
o M2 0.85170
o M5 0.82715
Active traders can use PML: 0.87215 as the initial pivot, maintaining a long position above that level and a flat or short position below it.
Summary
The power of technical analysis is in its ability to reduce multi-dimensional markets into a filtered two-dimensional space of price and time. Our methodology applies a consistent framework that identifies key measures of trend, distinct levels of support and resistance, and identification of potential trading ranges. Our methodology can be applied to any security or index, across markets, for which we can attain a reliable price history. We look forward to bringing you our unique brand of technical analysis and insight into many different markets. If you are a professional market participant and are open to discovering more, please connect with us. We are not asking for a subscription; we are asking you to listen.

Also Read


