


J. Brett Freeze and his firm Global Technical Analysis (GTA) provides RIA Pro subscribers Cartography Corner on a monthly basis. Brett’s analysis offers readers a truly unique brand of technical insight and risk framework. We personally rely on Brett’s research to help better gauge market trends, their durability, and support and resistance price levels.
GTA presents their monthly analysis on a wide range of asset classes, indices, and securities. At times the analysis may agree with RIA Pro technical opinions, and other times it will run contrary to our thoughts. Our goal is not to push a single view or opinion, but provide research to help you better understand the markets. Please contact us with any questions or comments. If you are interested in learning more about GTA’s services, please connect with them through the links provided in the article.
The link below penned by GTA provides a user’s guide and a sample of his analysis.
April 2020 Review
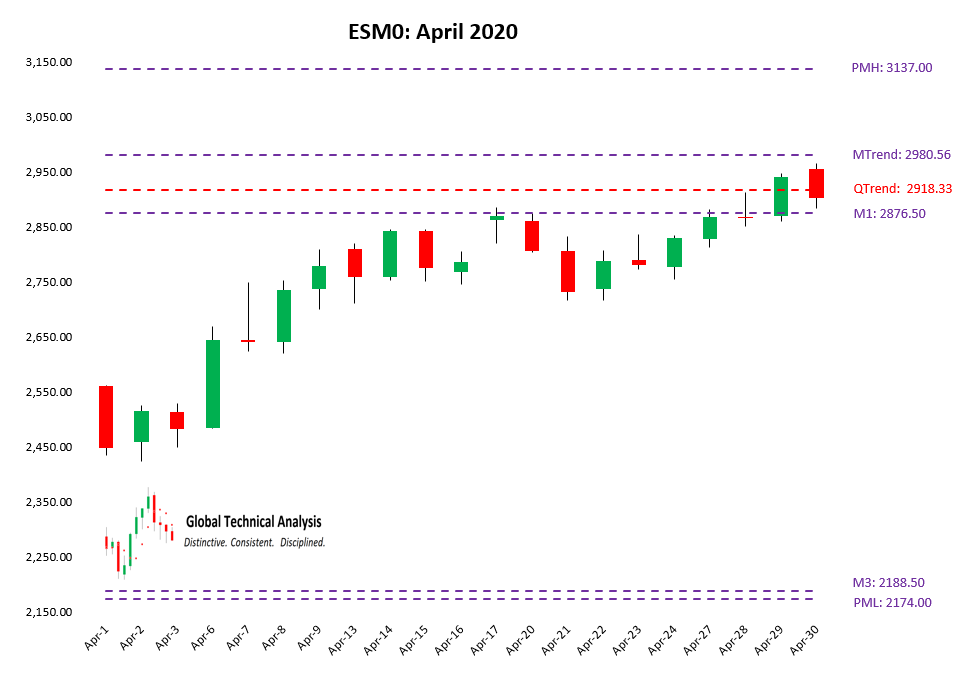
E-Mini S&P 500 Futures
We begin with a review of E-Mini S&P 500 Futures (ESM0) during April 2020. In our April 2020 edition of The Cartography Corner, we wrote the following:
In isolation, monthly support and resistance levels for April are:
- M4 3420.75
- PMH 3137.00
- MTrend 2980.56
- M1 2876.50
- Close 2569.75
- M3 2188.50
- PML 2174.00
- M2 1494.75
- M5 950.50
Given that the first monthly resistance and support levels are roughly 300 and 400 points away from the current market price, we suggest active traders rely upon our weekly analysis to guide them directionally. For less-active market participants with an intermediate or long time-period focus, we suggest using MTrend: 2980.56 and QTrend: 2918.33 as the pivot, respectively. Maintain a flat or short position below the pivot and a long position above the pivot.
Figure 1 below displays the daily price action for April 2020 in a candlestick chart, with support and resistance levels isolated by our methodology represented as dashed lines. The month of April extended the rally that began on March 23rd as a result of the Federal Reserve’s commitment to unlimited Quantitative Easing. Adding to the positive sentiment was the confluence of narratives around the April 29th FOMC meeting (negative rates), the “Big 5” technology companies earnings releases for 1Q2020, Gilead’s Remdesivir drug trials, and the partial “re-opening” of some state economies. Conveniently absent from those narratives was the fact that none of those will put 30 million people back to work.
The market price rallied into our isolated clustered-resistance levels at M1: 2876.50 / QTrend: 2918.33 / MTrend: 2980.56 and stopped. This occurred, despite hundreds of billions in fiscal stimulus, federal asset-backstop facilities, and a $6.6 trillion Federal Reserve Balance Sheet. Hmmm…
Active traders following our weekly analysis got long the week of April 6th with the move and settlement above Weekly Trend. Less-active market participants remained flat or short.
Figure 1:
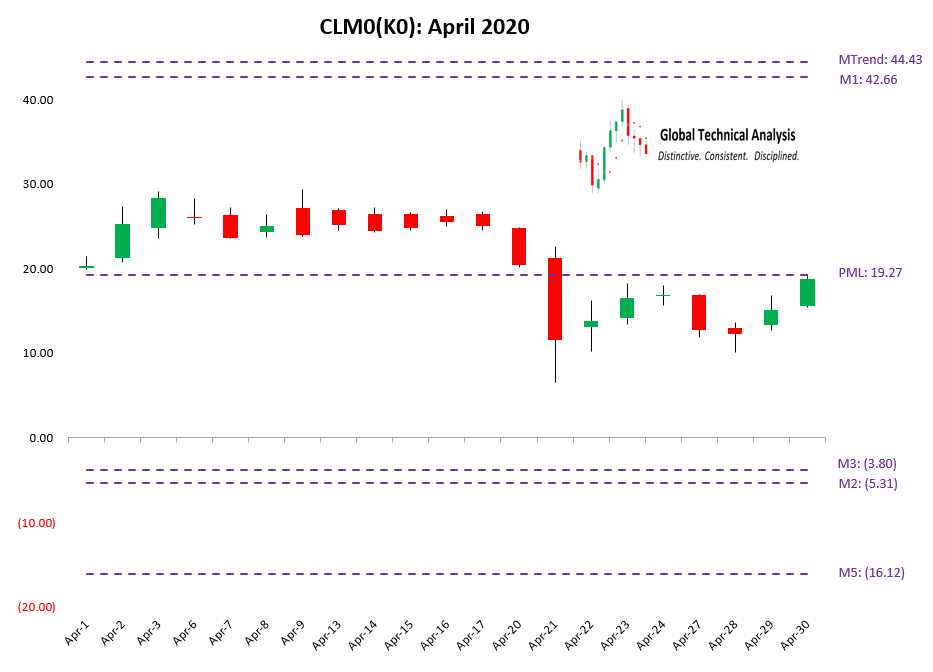
WTI Crude Oil Futures
We continue with a review of WTI Crude Oil Futures (CLM(K)0) during April 2020. In our April 2020 edition of The Cartography Corner, we wrote the following:
In isolation, monthly support and resistance levels for April are:
- M4 53.47
- PMH 48.66
- MTrend 44.43
- M1 42.66
- Close 20.48
- PML 19.27
- *M3 0.00
- *M2 0.00
- *M5 0.00
Active traders can use 19.27 as the pivot, whereby they maintain a long position above that level and a flat or short position below it.
*Our analysis identified negative prices for these support levels. However, we did not know that the exchange would allow negative prices to trade. Our code defaulted to zero. Given the events of April 21st, our code was changed and this is reflected in Figure 2.
Figure 2 below displays the daily price action for April 2020 in a candlestick chart, with support and resistance levels isolated by our methodology represented as dashed lines. The first 13 trading sessions of April saw the market price “hover” within a $9.42 range above our isolated pivot level at PML: 19.27.
On April 21st, the settlement day for the May contract, chaos erupted. Our isolated pivot level was breached early in the trading session. As a result of the well-advertised storage capacity constraints, the May contract settled at ($37.00).
The majority of market participants had already rolled their positions by Friday, April 17th. The “front” month typically rolls on the third Friday in the month before delivery. In our analysis, we roll 20% from the front month to the next month over the five-session period leading into and including the third Friday. As a result, the negative pricing realized in the May settlement contract is not reflected in our graph. We had effectively rolled to the June contract. Likewise, despite the frenzy surrounding the negative price, few market participants were involved. The remaining seven trading sessions were spent inside the trading range of April 21st.
Our analysis suggested a collapse below $19.27. The collapse was realized… and then some.
Figure 2:
May 2020 Analysis
E-Mini S&P 500 Futures
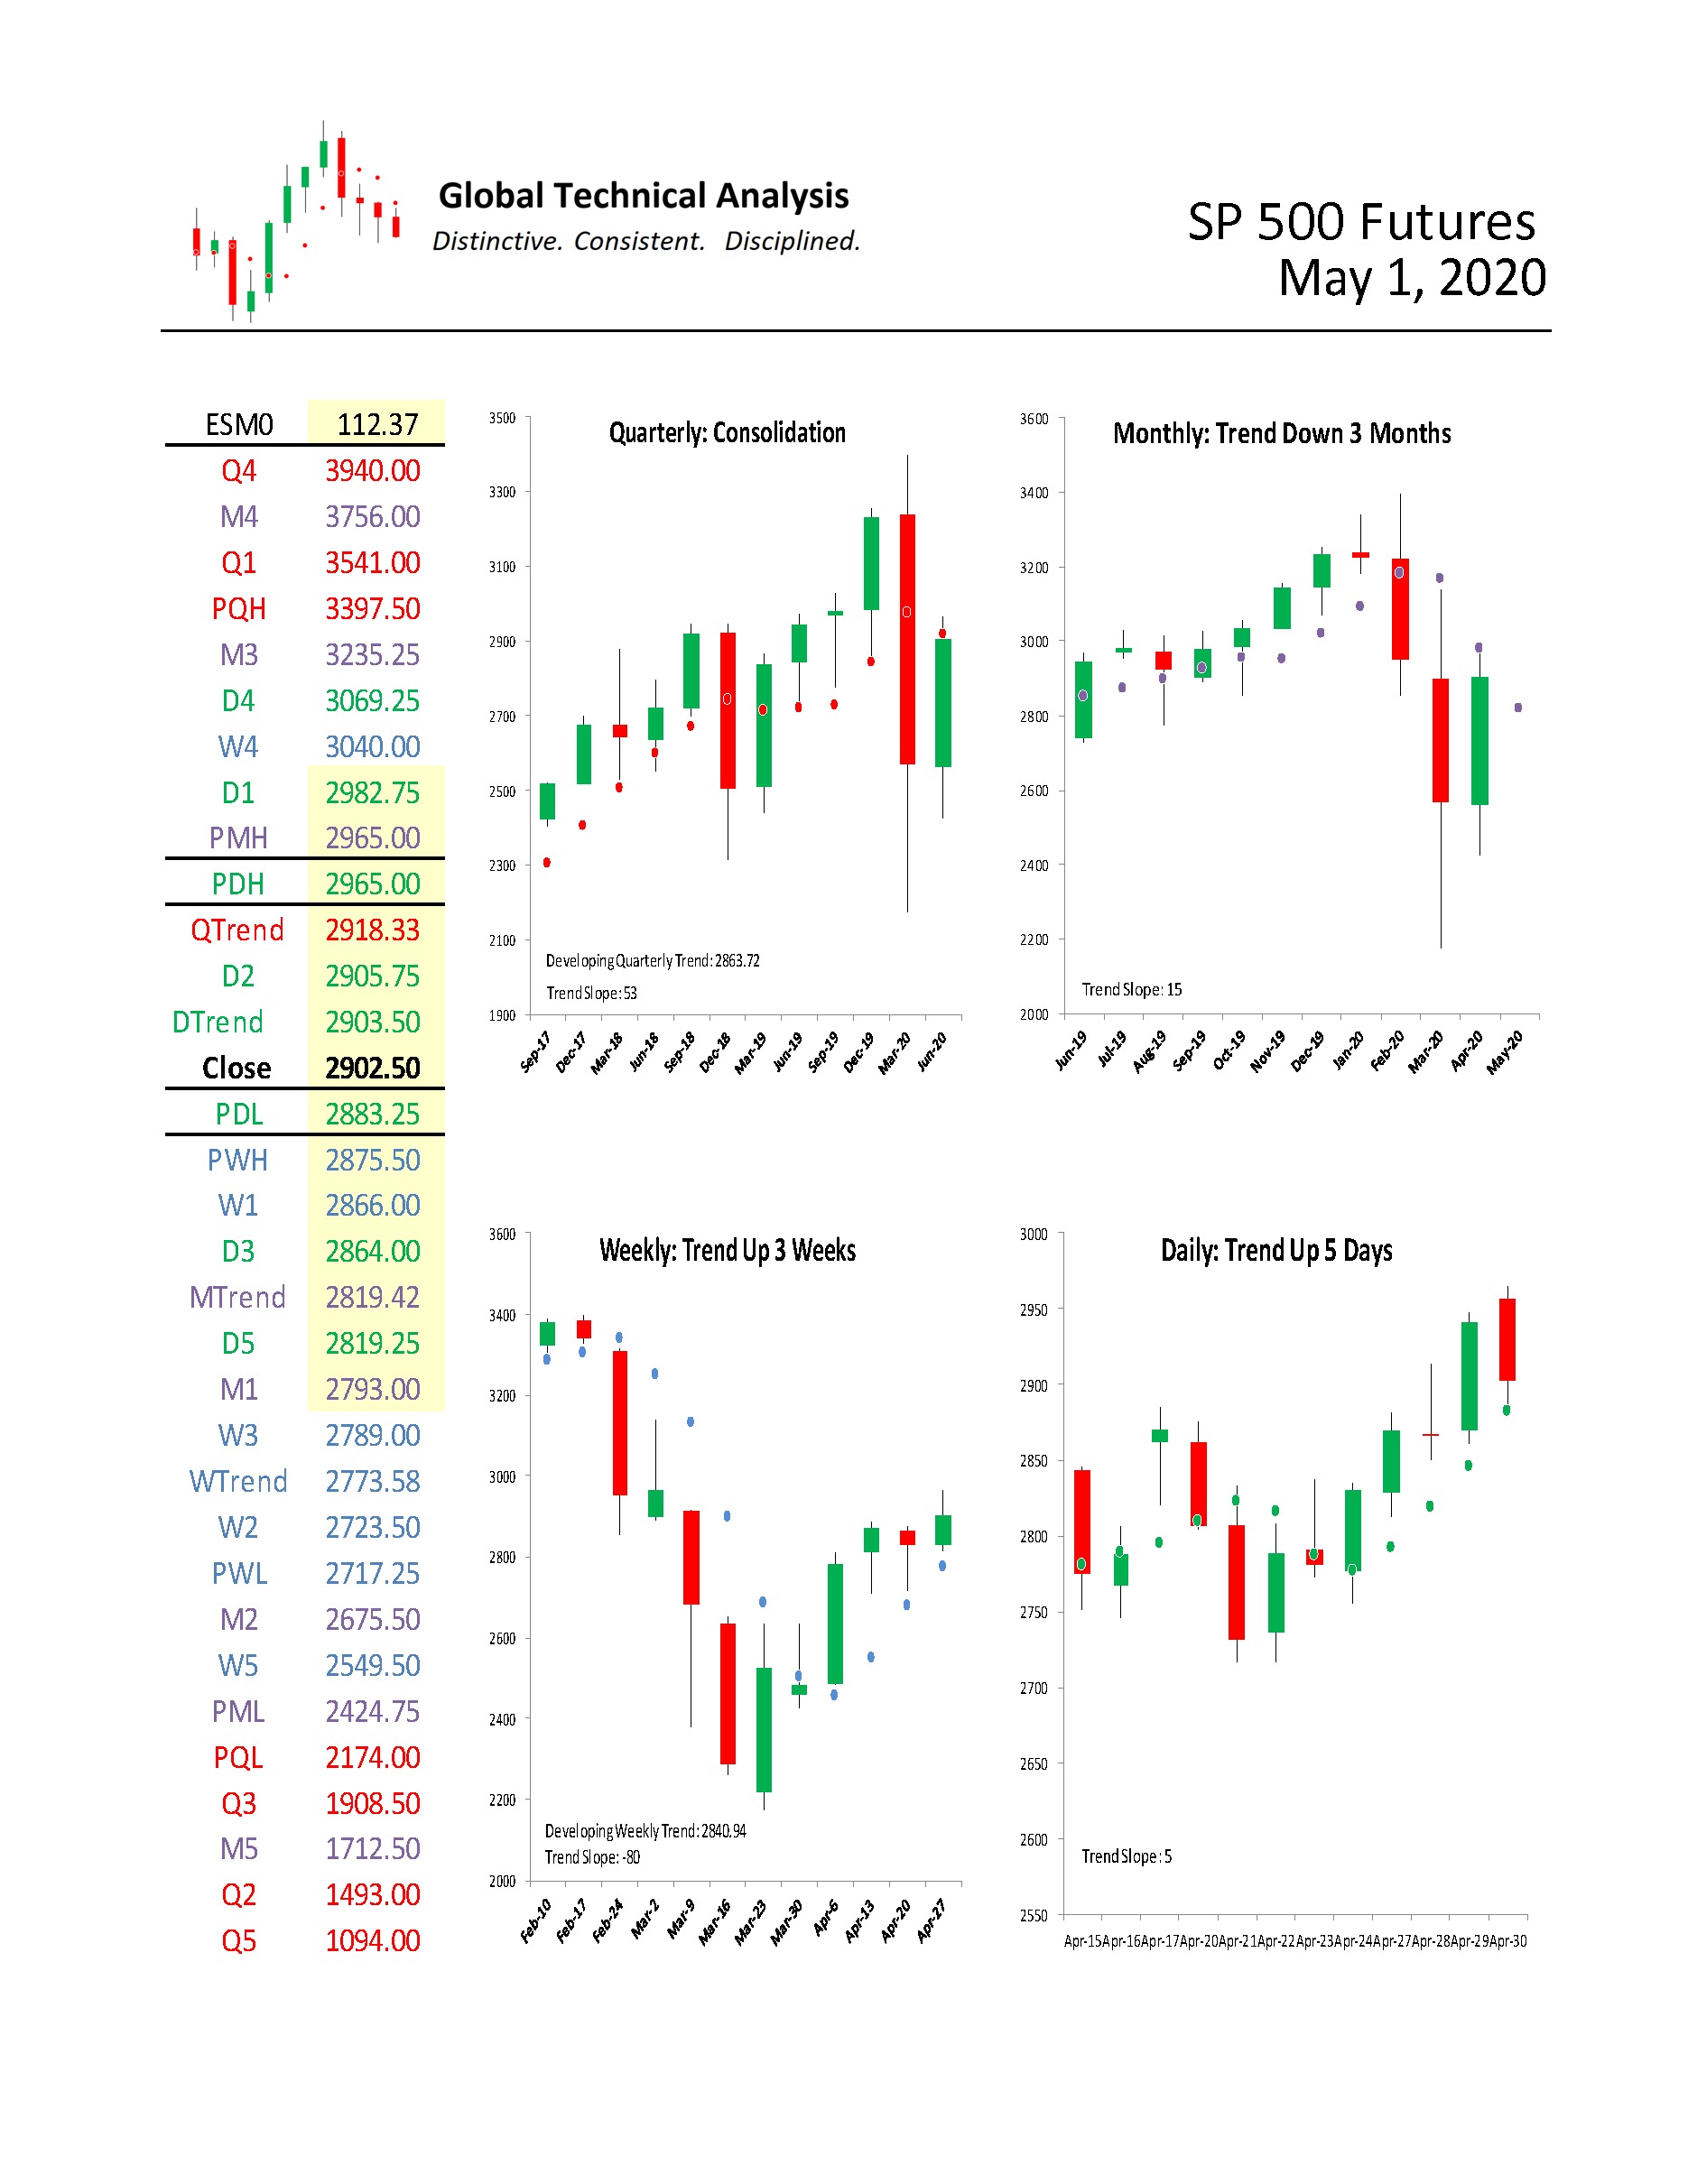
We begin by providing a monthly time-period analysis of E-Mini S&P 500 Futures (ESM0). The same analysis can be completed for any time-period or in aggregate.
Trends:
- Quarterly Trend 2918.33
- Daily Trend 2903.50
- Current Settle 2902.50
- Monthly Trend 2819.42
- Weekly Trend 2773.58
In the quarterly time-period, the chart shows that E-Mini S&P 500 Futures are in “Consolidation”, after having been “Trend Up” for four quarters. Stepping down one time-period, the monthly chart shows that E-Mini S&P 500 Futures are “Trend Down”, settling below Monthly Trend for three consecutive months. Stepping down to the weekly time-period, the chart shows that E-Mini S&P 500 Futures have been “Trend Up” for three weeks. The relative positioning of the Trend Levels is transitioning to a bearish posture.
One rule we have is to anticipate a two-period high (low), within the following four to six periods, after a Downside (Upside) Exhaustion level has been reached. We now anticipate a two-period high in the quarterly time- period over the next four to six quarters and in the monthly time-period over the next two to four months. It is important to remember, these two-period highs may occur at higher levels but can also occur at lower levels.
For bulls and bears alike, the performance of the market in May is crucial. Although the market price settled below April Monthly Trend causing us to characterize it as “Trend Down”, it is set to open the month of May above May Monthly Trend. May’s settlement will determine whether the market remains “Trend Down” or moves into “Consolidation”. We would anticipate follow-through buying with a settlement above May Monthly Trend.
Support/Resistance:
In isolation, monthly support and resistance levels for May are:
- M4 3756.00
- M3 3235.25
- PMH 2965.00
- Close 2902.50
- MTrend 2819.42
- M1 2793.00
- M2 2675.50
- PML 2424.75
- M5 1712.50
Active traders can use PMH: 2965.00 as the pivot, maintaining a long position above that level and a flat or short position below it.
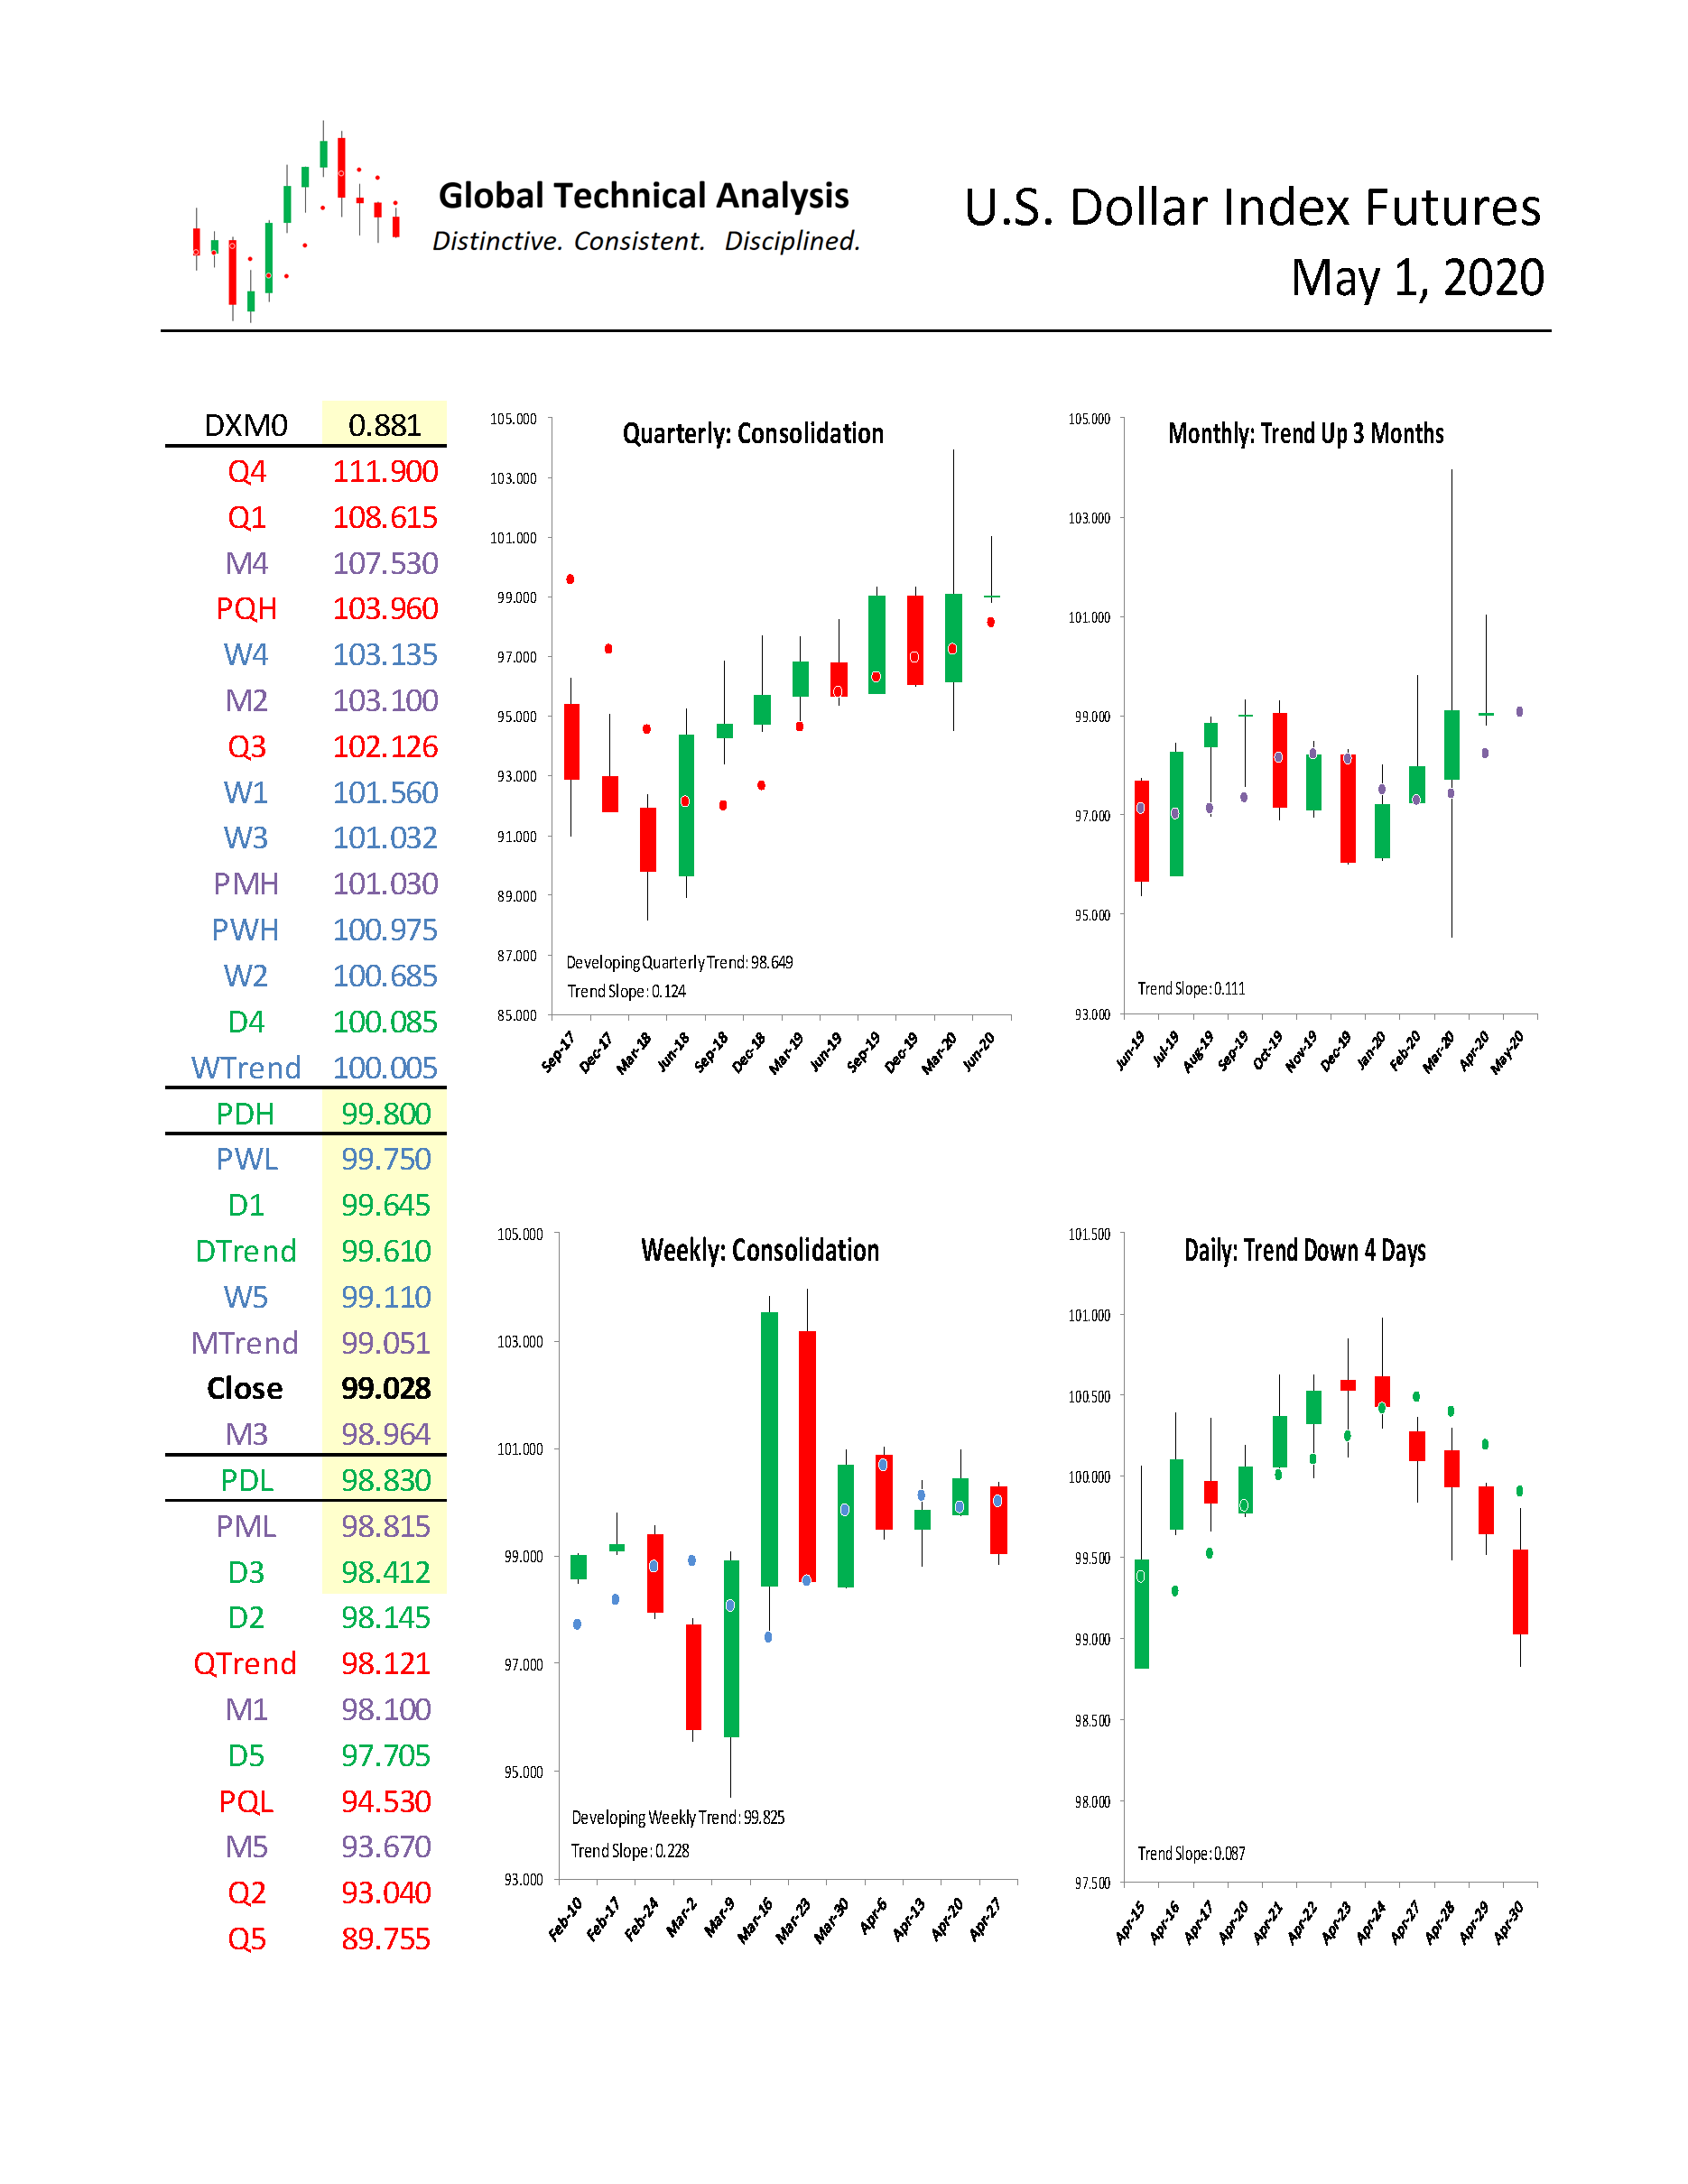
U.S. Dollar Index Futures
For May, we focus on U.S. Dollar Index Futures (“the dollar”). We provide a monthly time-period analysis of DXM0. The same analysis can be completed for any time-period or in aggregate.
Trends:
- Weekly Trend 100.005
- Daily Trend 99.610
- Monthly Trend 99.051
- Current Settle 99.028
- Quarterly Trend 98.121
As can be seen in the quarterly chart below, the dollar is in “Consolidation”. Stepping down one time-period, the monthly chart shows that the dollar has been “Trend Up” for three months. Stepping down to the weekly time-period, the chart shows that the dollar is in “Consolidation”.
We would like to draw your attention to the March 2020 candle on the monthly chart. The realized range for March was 9 big figures (94 to 103 in round numbers). We refer to that candle as the “control” candle. April’s trading activity is classified as an inside-month range. It will take a break of the March range to initiate the next substantial directional move in the dollar.
Support/Resistance:
In isolation, monthly support and resistance levels for May are:
- M4 107.530
- M2 103.100
- PMH 101.03
- MTrend 99.051
- Close 99.028
- M3 98.964
- PML 98.815
- M1 98.100
- M5 93.670
Active traders can use 99.051 as the upside pivot, whereby they maintain a long position above that level. Active traders can use 98.100 as the downside pivot, whereby they maintain a flat or short position below it.
Summary
The power of technical analysis is in its ability to reduce multi-dimensional markets into a filtered two-dimensional space of price and time. Our methodology applies a consistent framework that identifies key measures of trend, distinct levels of support and resistance, and identification of potential trading ranges. Our methodology can be applied to any security or index, across markets, for which we can attain a reliable price history. We look forward to bringing you our unique brand of technical analysis and insight into many different markets. If you are a professional market participant and are open to discovering more, please connect with us. We are not asking for a subscription; we are asking you to listen.

Also Read


