


J. Brett Freeze and his firm Global Technical Analysis (GTA) provides RIA Pro subscribers Cartography Corner on a monthly basis. Brett’s analysis offers readers a truly unique brand of technical insight and risk framework. We personally rely on Brett’s research to help better gauge market trends, their durability, and support and resistance price levels.
GTA presents their monthly analysis on a wide range of asset classes, indices, and securities. At times the analysis may agree with RIA Pro technical opinions, and other times it will run contrary to our thoughts. Our goal is not to push a single view or opinion, but provide research to help you better understand the markets. Please contact us with any questions or comments. If you are interested in learning more about GTA’s services, please connect with them through the links provided in the article.
The link below penned by GTA provides a user’s guide and a sample of his analysis.
May 2022 Review
E-Mini S&P 500 Futures
We begin with a review of E-Mini S&P 500 Futures (ESM2) in May 2022. In our May 2022 edition of The Cartography Corner, we wrote the following:
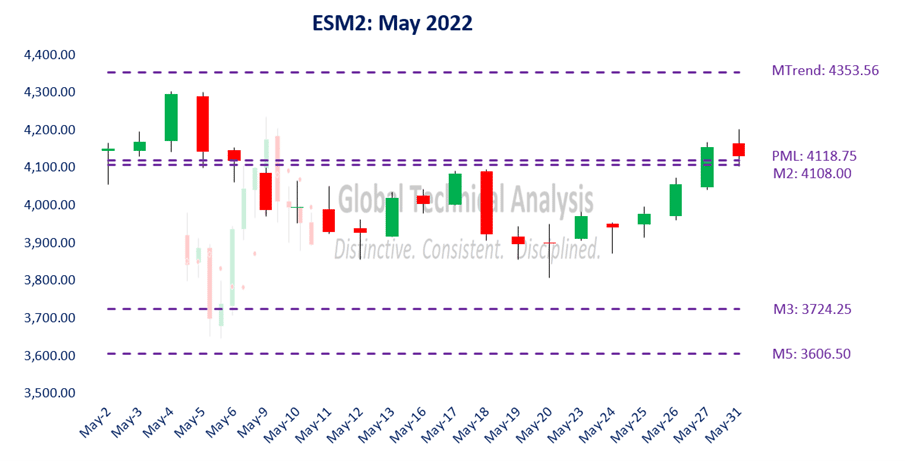
In isolation, monthly support and resistance levels for May are:
o M4 5048.00
o PMH 4588.75
o M1 4546.50
o MTrend 4353.56
o Close 4127.50
o PML 4118.75
o M2 4108.00
o M3 3724.25
o M5 3606.50
Active traders can use M2: 4108.00 as the pivot, maintaining a long position above that level and a flat or short position below it.
Figure 1 below displays the daily price action for May 2022 in a candlestick chart, with support and resistance levels isolated by our methodology represented as dashed lines. The first five trading sessions saw the market price test our clustered support levels at PML: 4118.75 / M2: 4108.00 yet settle above them. The following fourteen sessions saw the market price remain under our isolated pivot level at M2: 4108.00. The low price for the month was realized on May 20th at 3807.50. The final two trading sessions saw the market price rally back to, and settle above, our isolated pivot.
Active traders following our analysis, at worst, scratched on the trade.
Figure 1:
Soybean Futures
We continue with a review of Soybean Futures (ZSN2) during May 2022. In our May 2022 edition of The Cartography Corner, we wrote the following:
In isolation, monthly support and resistance levels for May are:
o M4 18.5844
o M3 17.5504
o PMH 17.3400
o M1 17.3160
o Close 16.8460
o MTrend 16.4738
o PML 15.6688
o M2 15.2420
o M5 13.9736
Active traders can use MTrend: 16.4738 as the initial pivot, maintaining a long position above that level and a flat or short position below it.
Figure 2 below displays the daily price action for May 2022 in a candlestick chart, with support and resistance levels isolated by our methodology represented as dashed lines. Our isolated pivot at MTrend: 16.4738 bifurcated the realized price action well. The first ten trading sessions saw the market price settle under Monthly Trend. The final eleven trading sessions saw the market price settle above Monthly Trend.
The purpose of every trading month is to surpass the high and (or) low of the previous trading month. On May 9th the low price for the month was realized at 15.7800, roughly eight cents above April’s low price. Having failed to take out April’s low, the remainder of the month saw the market price attempt to take out April’s high. On May 26th, the market price “took out” April’s high price at 17.3400. The purpose of the May trading month was achieved.
Active traders following our analysis, conservatively, realized a profit of 4.75%.
Figure 2:

June 2022 Analysis
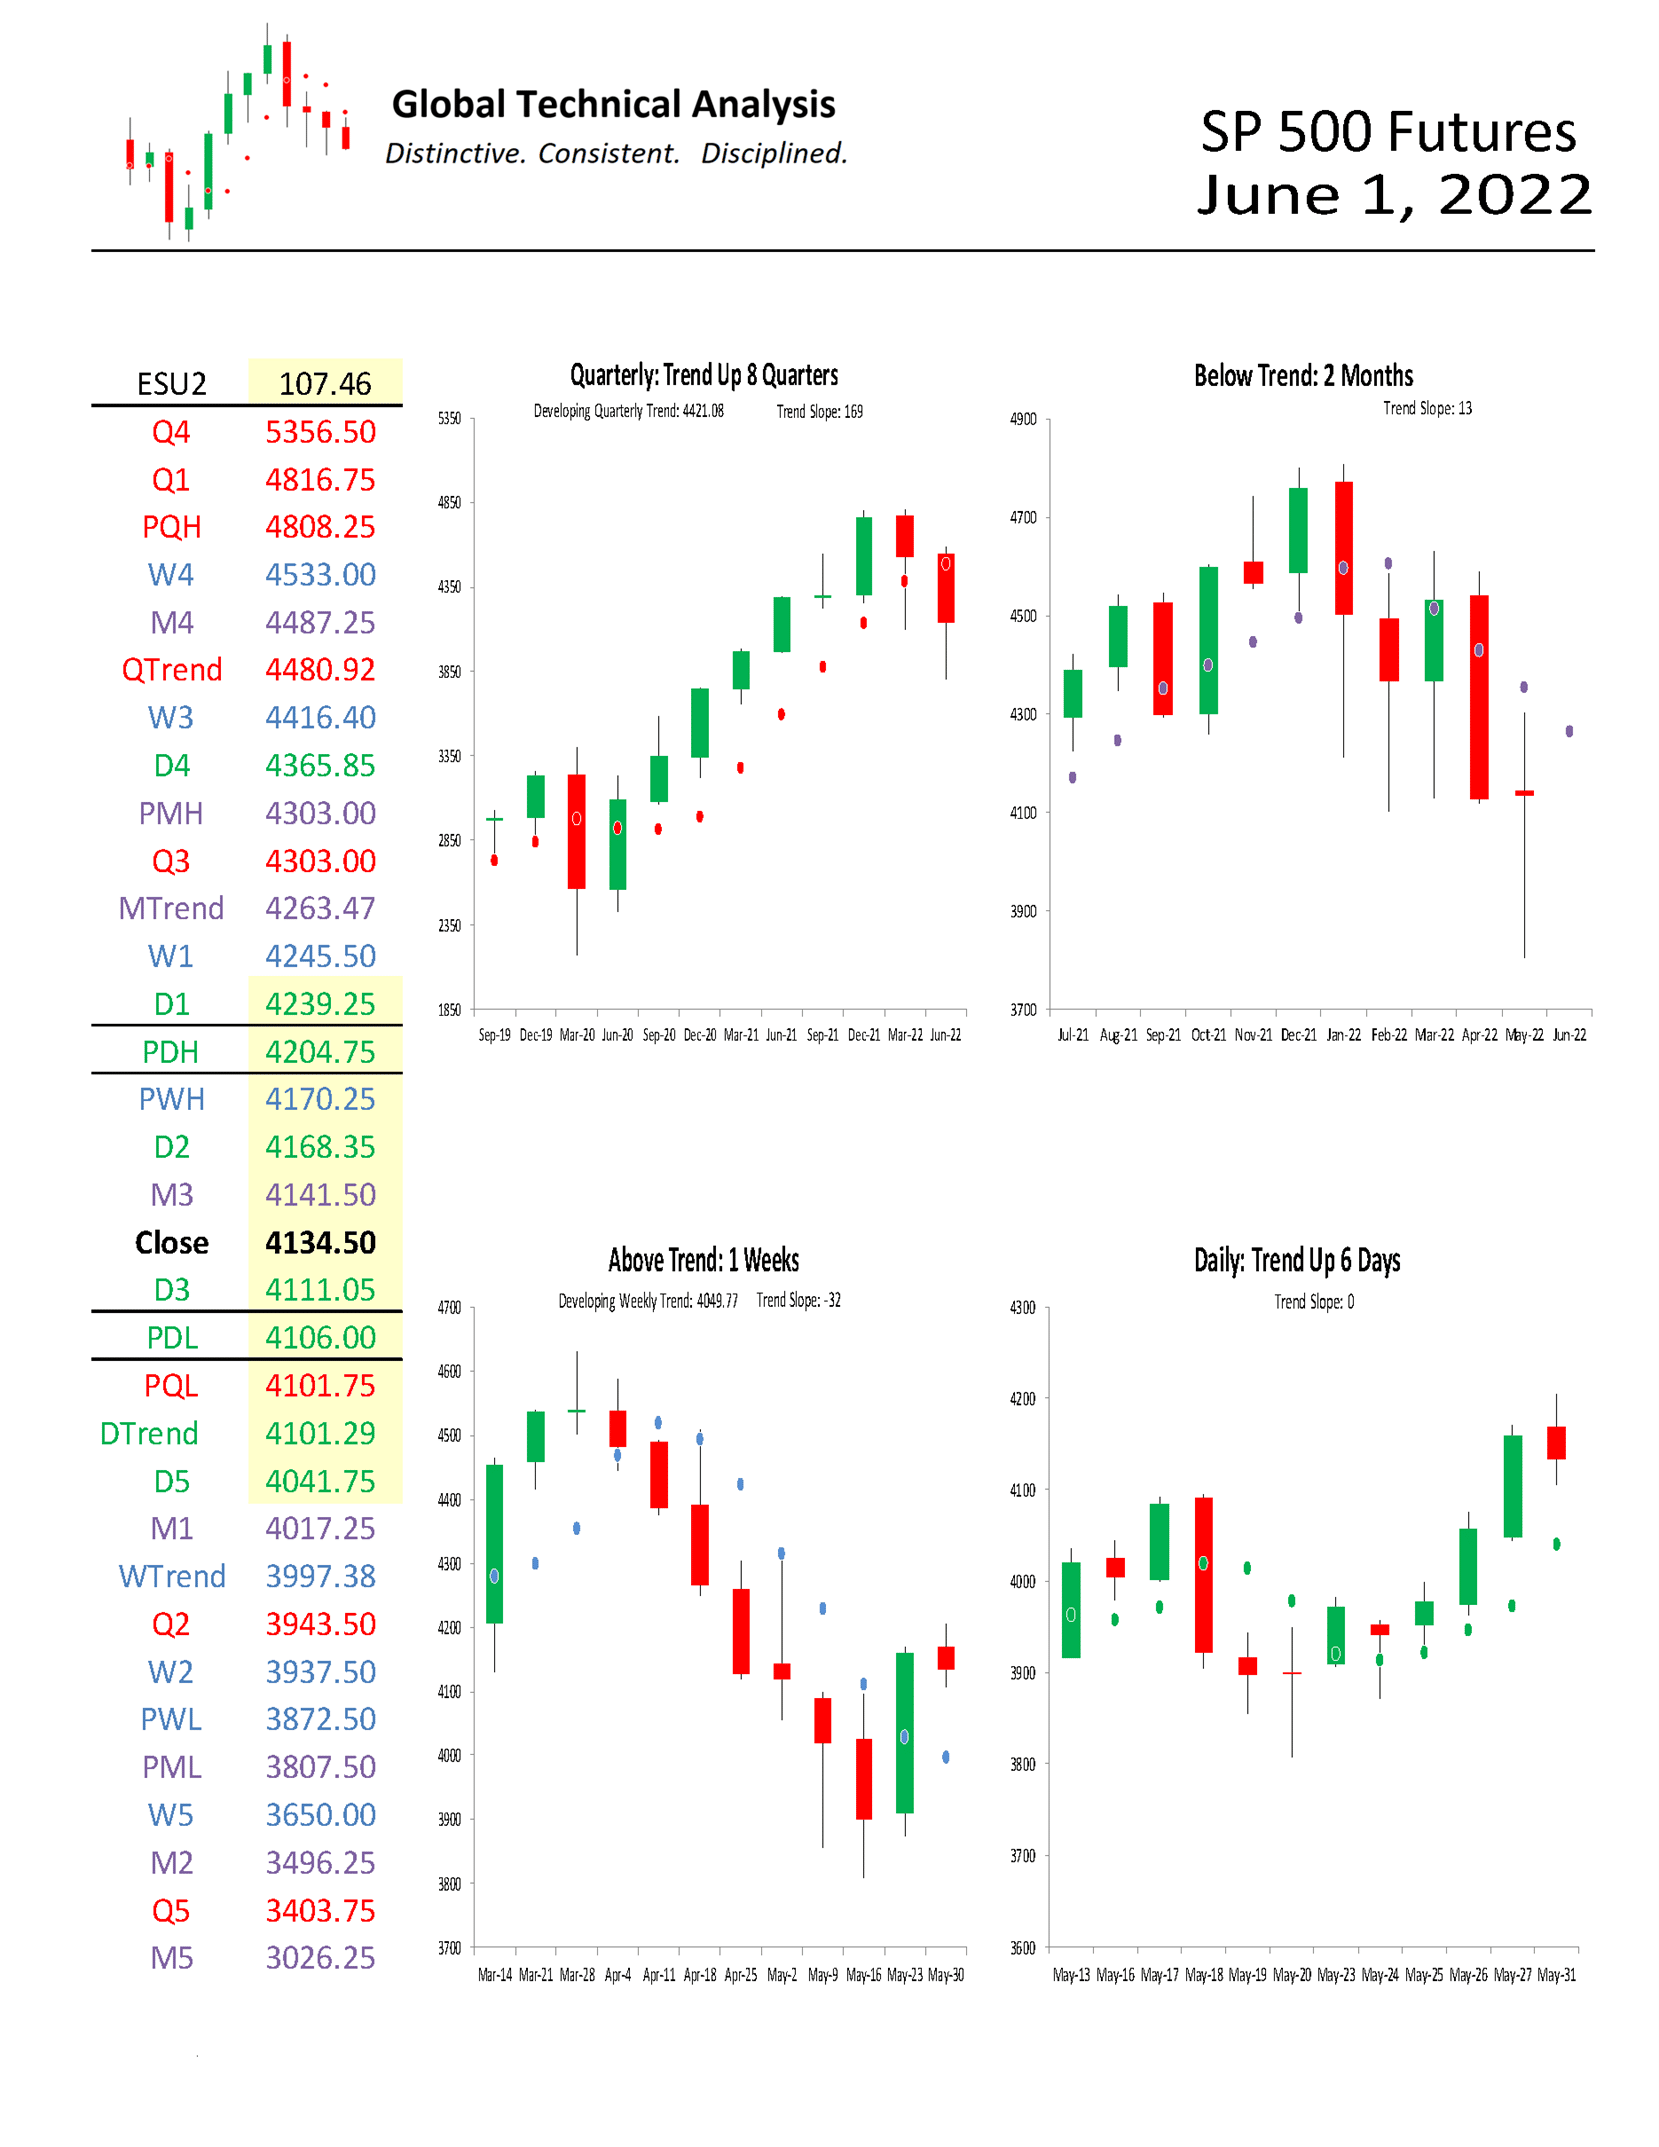
We begin by providing monthly time-period analysis of E-Mini S&P 500 Futures (ESU2). The same analysis can be completed for any time-period or in aggregate.
Trends:
o Quarterly Trend 4480.92
o Monthly Trend 4263.47
o Current Settle 4134.50
o Daily Trend 4101.29
o Weekly Trend 3997.38
The relative positioning of the Trend Levels is bearish. Think of the relative positioning of the Trend Levels like you would a moving-average cross. In the quarterly time-period, the chart shows that E-Mini S&P 500 Futures are “Trend Up: 8 Quarters”. Stepping down one time-period, the monthly chart shows that E-Mini S&P 500 Futures are “Below Trend: 2 Months”. Stepping down to the weekly time-period, the chart shows that E-Mini S&P 500 Futures are “Above Trend: 1 Weeks”.
One rule we have is to anticipate a two-period high (low), within the following four to six periods, after a Downside (Upside) Exhaustion level has been reached. A signal was given in January to anticipate a two-month high within the next four to six months (now, one to three). That high can be achieved in June with a trade above 4588.75. A signal was given the week of April 4th to anticipate a two-week high within the next four to six weeks. That high was achieved last week, the seventh from the signal date, with the trade above 4099.00.
Trend Persistence, which measures the strength of the trend across multiple periods, is no longer suggesting that the market is oversold.
Support/Resistance:
In isolation, monthly support and resistance levels for June are:
o M4 4487.25
o PMH 4303.00
o MTrend 4263.47
o M3 4141.50
o Close 4134.50
o M1 4017.25
o PML 3807.50
o M2 3496.25
o M5 3026.50
Active traders can use M3: 4141.50 as the pivot, maintaining a long position above that level and a flat or short position below it.
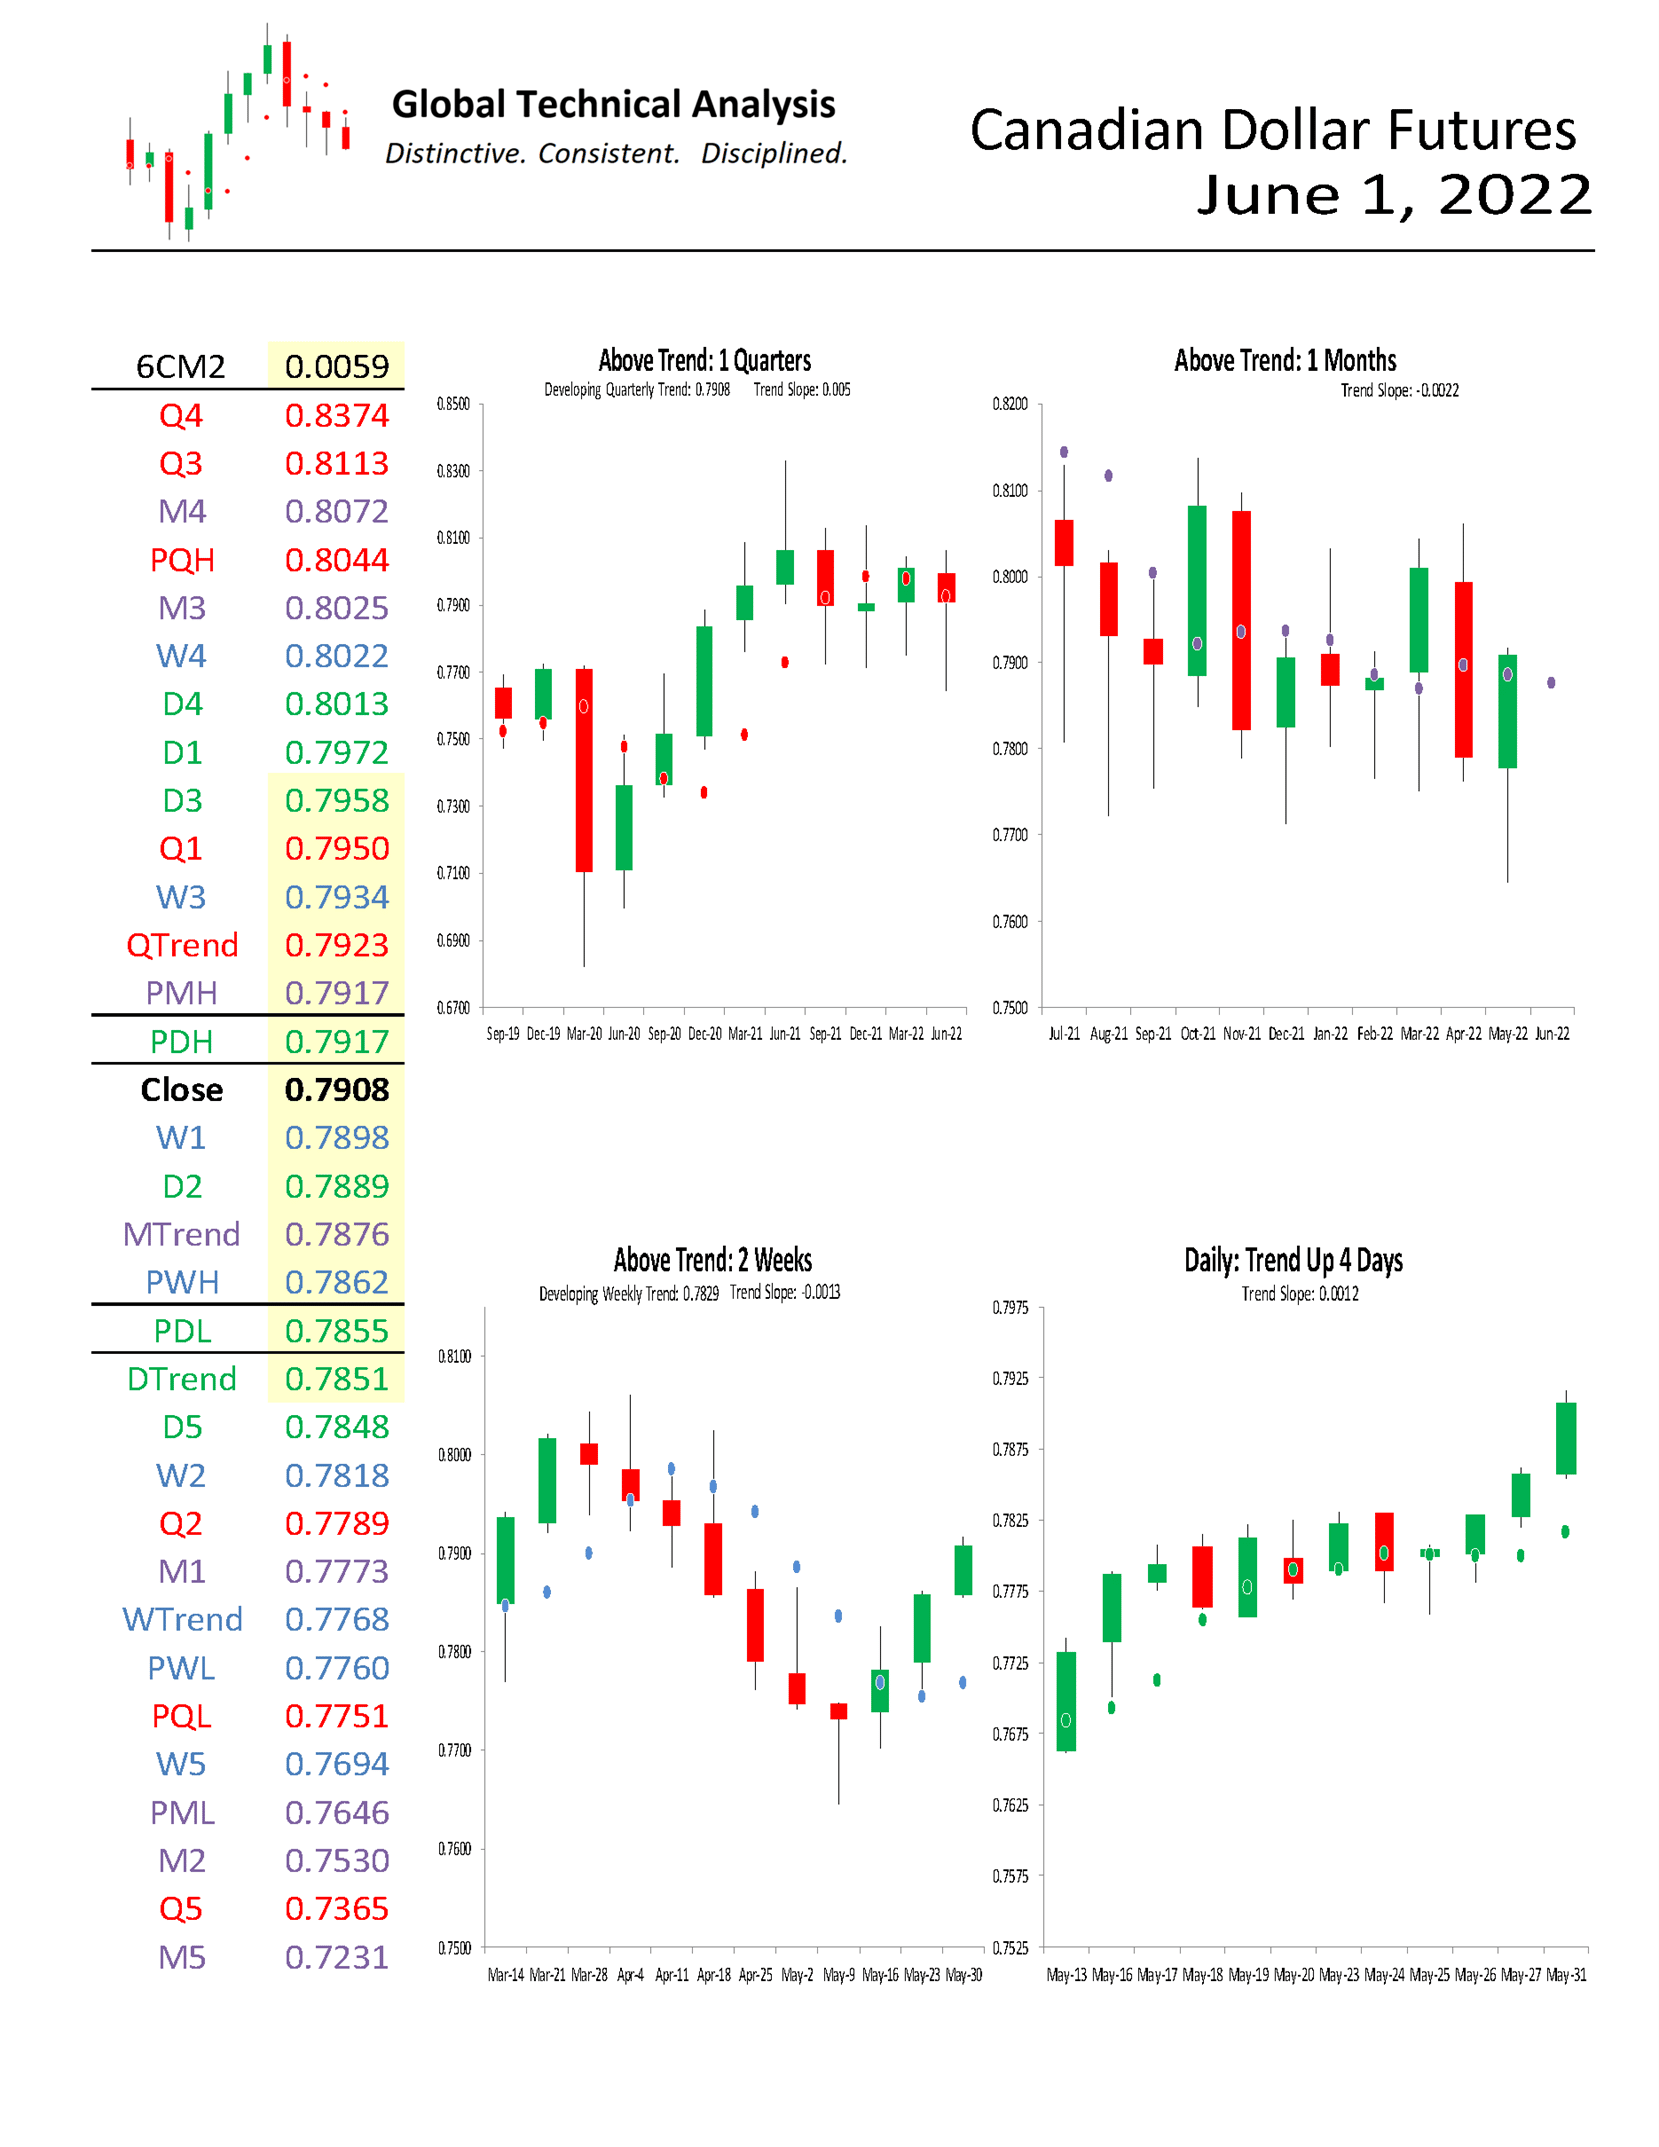
Canadian Dollar Futures
For June, we focus on Canadian Dollar Futures (“the Loonie”). We provide a monthly time-period analysis of 6CM2. The same analysis can be completed for any time-period or in aggregate.
Trends:
o Quarterly Trend 0.7923
o Current Settle 0.7908
o Monthly Trend 0.7876
o Daily Trend 0.7851
o Weekly Trend 0.7768
The relative positioning of the Trend Levels is bearish. Think of the relative positioning of the Trend Levels like you would a moving-average cross. As can be seen in the quarterly chart below, the Loonie is “Above Trend: 1 Quarters”. Stepping down one time-period, the monthly chart shows that the Loonie is “Above Trend: 1 Months”. Stepping down to the weekly time-period, the chart shows that the Loonie is “Above Trend: 2 Weeks”.
One rule we have is to anticipate a two-period low (high), within the following four to six periods, after an Upside (Downside) Exhaustion level has been reached. A signal was given the week of May 16th to anticipate a two-week low within the next four to six weeks (now two to four). That low can be achieved this week with a trade below 0.7760.
Trend Persistence and Monthly Momentum are both essentially neutral.
Support/Resistance:
In isolation, monthly support and resistance levels for June are:
o M4 0.8072
o M3 0.8025
o PMH 0.7917
o Close 0.7908
o MTrend 0.7876
o M1 0.7773
o PML 0.7646
o M2 0.7530
o M5 0.7231
Active traders can use MTrend: 0.7876 as the initial pivot, maintaining a long position above that level and a flat or short position below it.
Summary
The power of technical analysis is in its ability to reduce multi-dimensional markets into a filtered two-dimensional space of price and time. Our methodology applies a consistent framework that identifies key measures of trend, distinct levels of support and resistance, and identification of potential trading ranges. Our methodology can be applied to any security or index, across markets, for which we can attain a reliable price history. We look forward to bringing you our unique brand of technical analysis and insight into many different markets. If you are a professional market participant and are open to discovering more, please connect with us. We are not asking for a subscription; we are asking you to listen.

Also Read


