


J. Brett Freeze and his firm Global Technical Analysis (GTA) provides RIA Pro subscribers Cartography Corner on a monthly basis. Brett’s analysis offers readers a truly unique brand of technical insight and risk framework. We personally rely on Brett’s research to help better gauge market trends, their durability, and support and resistance price levels.
GTA presents their monthly analysis on a wide range of asset classes, indices, and securities. At times the analysis may agree with RIA Pro technical opinions, and other times it will run contrary to our thoughts. Our goal is not to push a single view or opinion, but provide research to help you better understand the markets. Please contact us with any questions or comments. If you are interested in learning more about GTA’s services, please connect with them through the links provided in the article.
The link below penned by GTA provides a user’s guide and a sample of his analysis.
May 2021 Review
E-Mini S&P 500 Futures
We begin with a review of E-Mini S&P 500 Futures (ESM1) during May 2021. In our May 2021 edition of The Cartography Corner, we wrote the following:
In isolation, monthly support and resistance levels for May are:
o Q4 4742.50
o M4 4701.50
o M1 4438.25
o M3 4381.50
o Q1 4214.50
o PMH 4211.00
o M2 4208.50
o Q3 4186.25
o Close 4174.50
o PML 3964.50
o M5 3945.25
o MTrend 3938.53
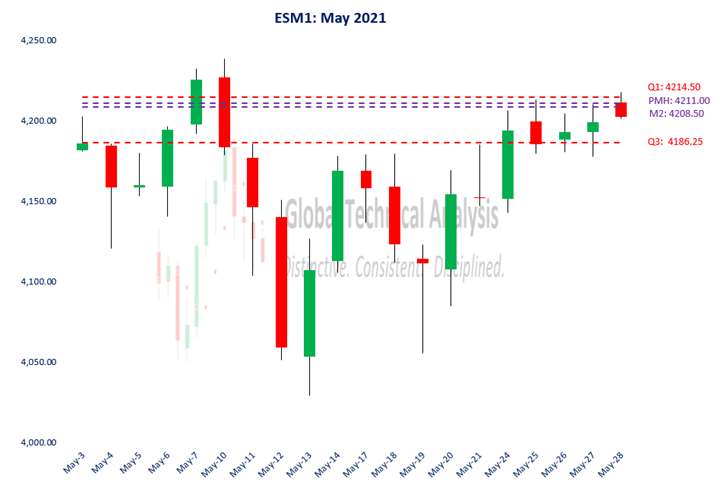
Active traders can use Q1: 4214.50 as the pivot, maintaining a long position above that level and a flat or short position below it.
Figure 1 below displays the daily price action for May 2021 in a candlestick chart, with support and resistance levels isolated by our methodology represented as dashed lines. The first two trading sessions began with the market price ascending to just below Clustered Resistance at M2: 4208.50 / PMH: 4211.00 / Q1: 4214.50 and being rejected. The reversal from the high price of May 3rd to the low price of May 4th totaled 82 points. However, by the session’s close, the market price had recovered significantly. The following three sessions saw the market price ascend to, and settle above, our isolated pivot at Q1: 4214.50. Early in the session on May 10th, the market price put in a six-point higher high at 4238.25. It never saw that price again. Over the remainder of that trading session and the following two, the market price declined a total of -166.50 points, or (3.94%), on a closing basis.
The realized price action for the remainder of May consisted of more of the same, three swings (up, down, up) followed by a consolidation. The month ended with the market price, again, testing our isolated pivot level at Q1: 4214.50.
Up Swings:
- May 13 – May 14, +149.00 points, low-to-high
- May 19 – May 24, +150.75 points, low-to-high
Down Swing:
- May 17 – May 19, -123.25 points, high-to-low
Consolidation:
- May 25 – May 28, +17.00 points, close-to-close
Much like running on a treadmill, the market expended a lot of energy in the swings and essentially went nowhere, settling 28.00 points higher than April.
Figure 1:
Soybean Futures
We continue with a review of Soybean Futures (ZSN1) during May 2021. In our May 2021 edition of The Cartography Corner, we wrote the following:
In isolation, monthly support and resistance levels for May are:
o Q4 19.0700
o M4 17.9228
o M1 16.8920
o M3 16.3900
o Q1 15.9940
o Q2 15.8300
o PMH 15.7460
o Q3 15.4780
o Close 15.3420
o MTrend 14.3512
o M2 13.9228
o PML 13.7460
o M5 12.8920
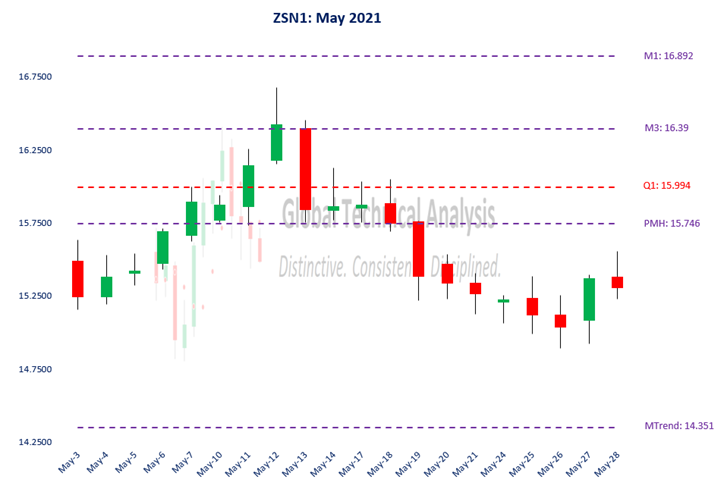
Active traders can use Q1: 15.9940 as the pivot, maintaining a long position above that level and a flat or short position below it.
Figure 2 below displays the daily price action for May 2021 in a candlestick chart, with support and resistance levels isolated by our methodology represented as dashed lines. Within the overall context of essentially unchanged prices, the realized price action in May consisted of two swings. The two-period low we were anticipating, highlighted in May’s edition, was realized the week of May 17th.
Up Swing:
- May 3 – May 12, +10.0%, low-to-high
Down Swing:
- May 12 – May 26, (10.7%), high-to-low
Again, much like running on a treadmill, the market expended a lot of energy in the swings and essentially went nowhere, settling (0.24%) lower than April.
Figure 2:
June 2021 Analysis
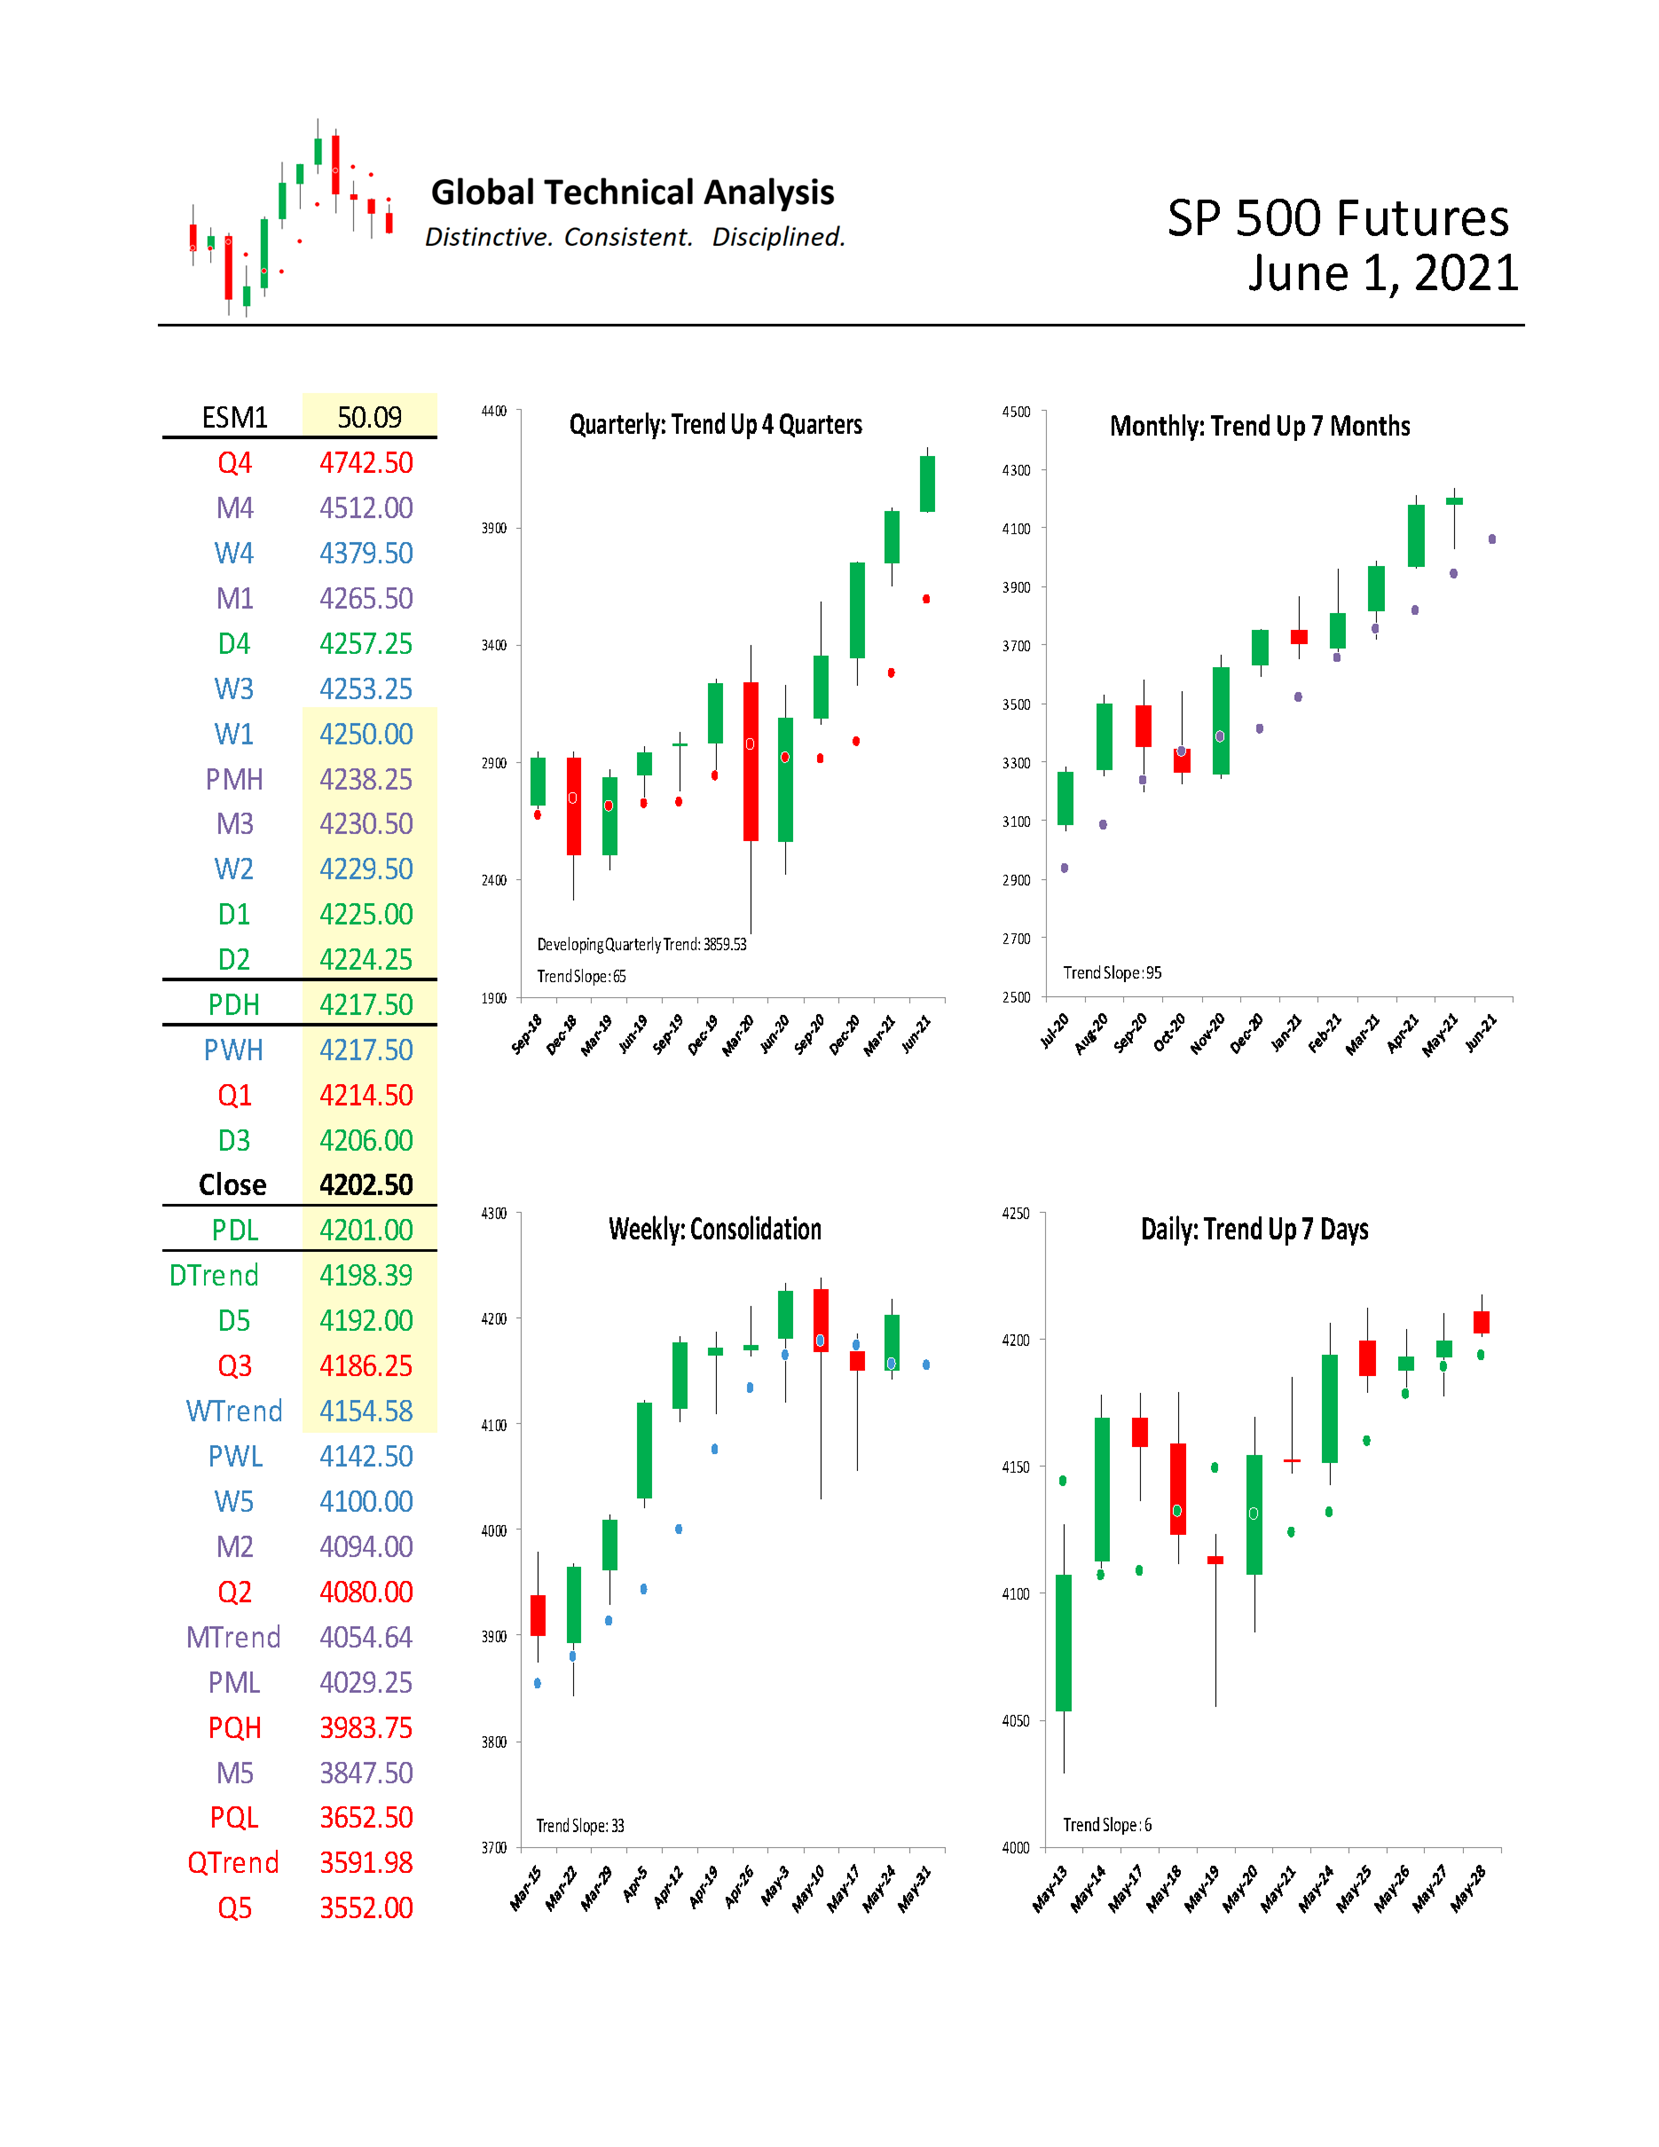
We begin by providing monthly time-period analysis of E-Mini S&P 500 Futures (ESM1). The same analysis can be completed for any time-period or in aggregate.
Trends:
o Current Settle 4202.50
o Daily Trend 4198.39
o Weekly Trend 4154.58
o Monthly Trend 4054.64
o Quarterly Trend 3591.98
The relative positioning of the Trend Levels is as bullish as possible. Think of the relative positioning of the Trend Levels like you would a moving-average cross. In the quarterly time-period, the chart shows that E-Mini S&P 500 Futures are “Trend Up”, having settled above Quarterly Trend for four quarters. Stepping down one time-period, the monthly chart shows that E-Mini S&P 500 Futures are “Trend Up”, settling seven months above Monthly Trend. Stepping down to the weekly time-period, the chart shows that E-Mini S&P 500 Futures are in “Consolidation”.
One rule we have is to anticipate a two-period high (low), within the following four to six periods, after a Downside (Upside) Exhaustion level has been reached. The signal was given the week of May 10th to anticipate a two-week high within the next four to six weeks (now, two to four weeks). That high can be achieved this week with a trade above 4217.50.
Support/Resistance:
In isolation, monthly support and resistance levels for June are:
o M4 4512.00
o M1 4265.50
o PMH 4238.25
o M3 4230.50
o Close 4202.50
o M2 4094.00
o MTrend 4054.64
o PML 4029.25
o M5 3847.50
Active traders can use M1: 4265.50 as the pivot, maintaining a long position above that level and a flat or short position below it.
Canadian Dollar Futures
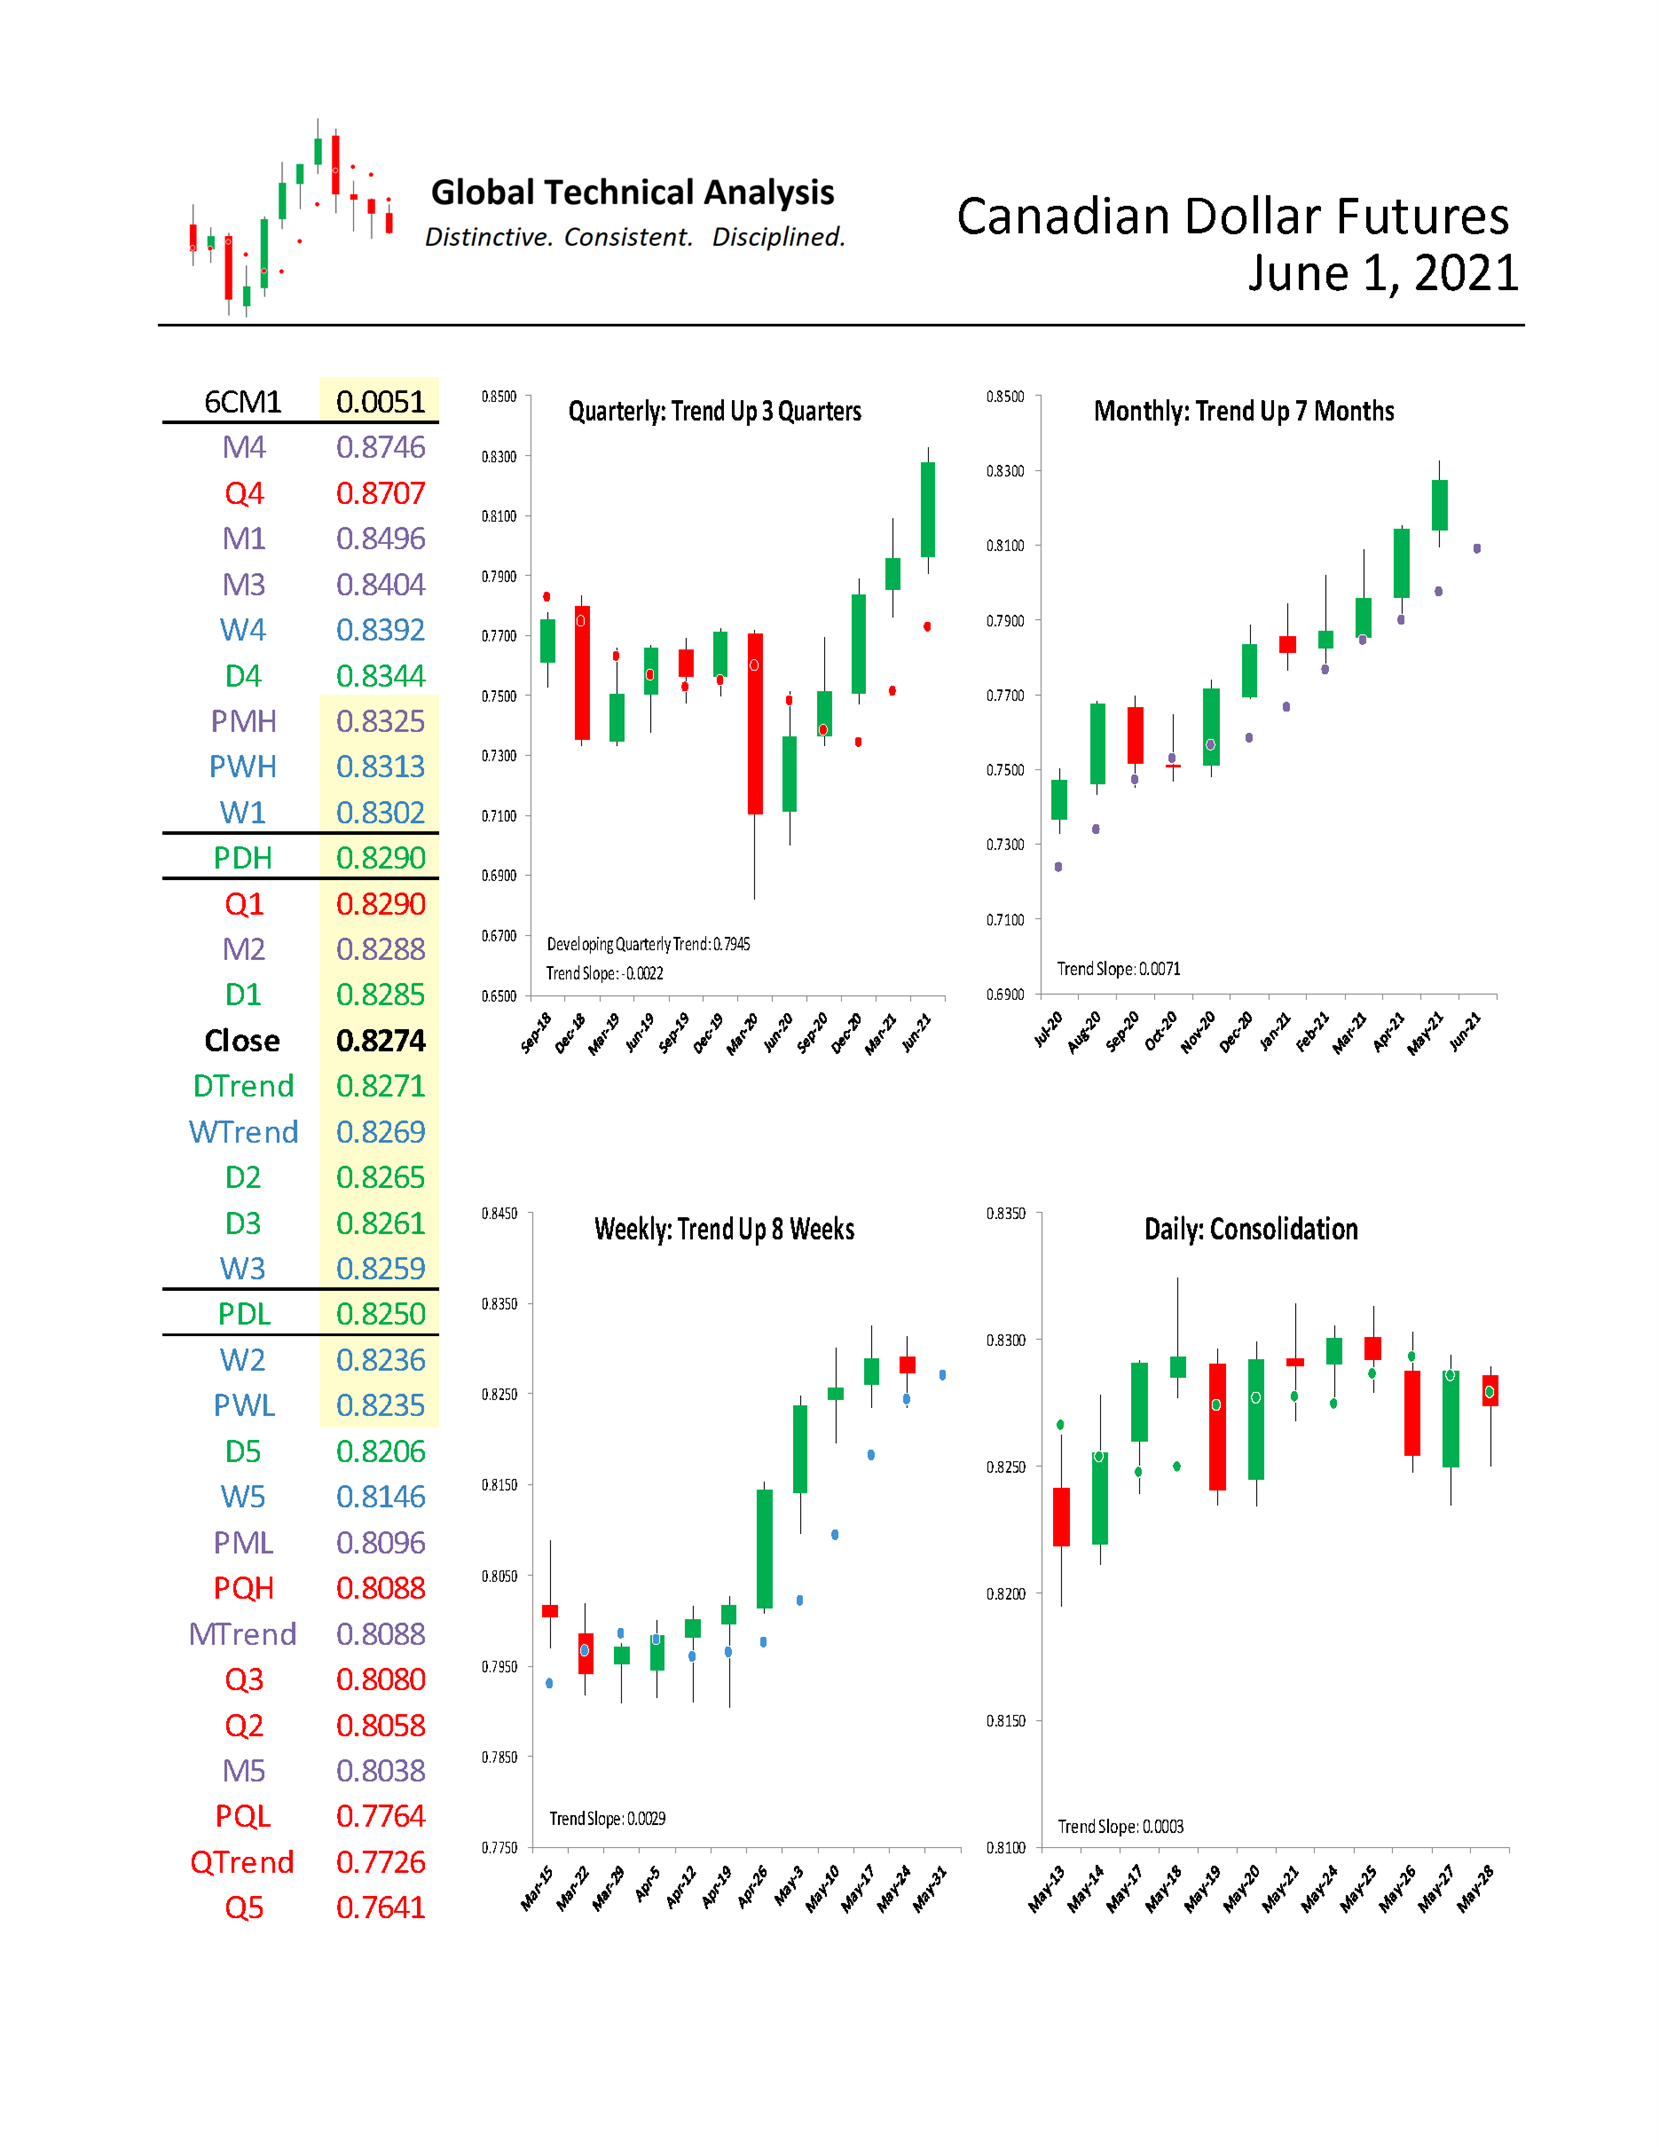
For June, we focus on Canadian Dollar Futures (“the Loonie”). We provide a monthly time-period analysis of 6CM1. The same analysis can be completed for any time-period or in aggregate.
Trends:
o Current Settle 0.8274
o Daily Trend 0.8271
o Weekly Trend 0.8269
o Monthly Trend 0.8088
o Quarterly Trend 0.7726
The relative positioning of the Trend Levels is bullish yet shows early indications of a possible phase transition. Think of the relative positioning of the Trend Levels like you would a moving-average cross. As can be seen in the quarterly chart below, the Loonie is “Trend Up”, having settled above Quarterly Trend for three quarters. Stepping down one time-period, the monthly chart shows that the Loonie is “Trend Up”, having settled above Monthly Trend for seven months. Stepping down to the weekly time-period, the chart shows that the Loonie is “Trend Up”, settling above Weekly Trend for eight weeks.
The early indications of a possible phase transition that we referred to are related to two aspects. First, Weekly Trend has risen to be at-the-market. It will only take a (0.0006) decline for the bears to be “in control” in the weekly time-period. Secondly, the slope of the Weekly Trend has started to flatten out. From the week of April 19th, the distance (measured in points from the previous week) between observations of Weekly Trend progressed as follows: 0.0045, 0.0073, 0.0089, 0.0060, and 0.0027. It peaked two weeks ago. The blue dots on the weekly graph are starting to crest.
Figure 3 below, shows the relative positioning of Speculative Money and Patient Money. As a review, we noted the following in May.
We model the positioning of these participants within the context of price and volatility, measured as Z-Score. This allows us to not have to depend upon Commitment of Traders reports which reflect a time delay. The correlations noted in the graph are between our model positioning and the complete set of actual historical COT reports.
Speculative Money participants’ decision-making framework centers on momentum, trend, and price. They typically employ leverage and focus on short time-periods. Patient Money participants’ decision-making framework centers on value, mean-reversion, and fundamental reality. They typically do not employ leverage and play the long game.
Concerning commodity trading, our experience suggests that you want to trade with the Speculative Money except for at extreme positioning. At the extreme, the speculative narrative is likely fully reflected in the price (and we should anticipate mean-reversion).
Figure 3:
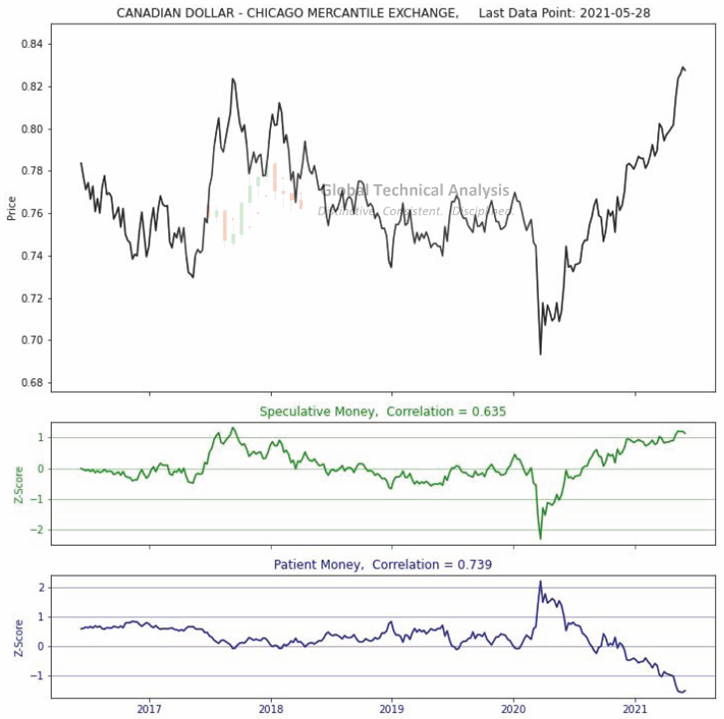
Figure 4 below, shows the Structural Momentum of the Loonie, using monthly inputs. Structural Momentum measures the absolute dispersion of returns, in units of Z-Score. The red and green diamonds are scripted to appear when a certain Confidence Interval is reached. They do not appear often and isolate significant turning points in price well. Caution is warranted.
Figure 4:
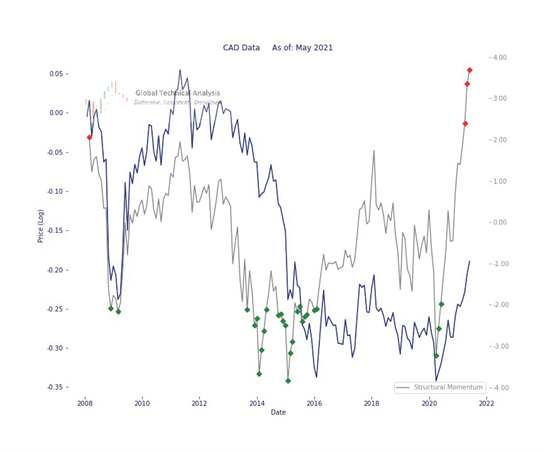
One rule we have is to anticipate a two-period low (high), within the following four to six periods, after an Upside (Downside) Exhaustion level has been reached. The signal was given the week of April 26th to anticipate a two-week low within the next four to six weeks (now, one to three weeks). That low can be achieved this week with a trade below 0.8234.
30% of Canada’s top exports are commodity-based, including: mineral fuels and oil (17.7%), gems & precious metals (5.9%), wood (3.4%), and ores/slag/ash (2.5%). The rise in the Loonie reflects the rise in commodity prices and inflation. A reversal of its price trend could have broader implications.
Support/Resistance:
In isolation, monthly support and resistance levels for June are:
o M4 0.8746
o M1 0.8496
o M3 0.8404
o PMH 0.8325
o M2 0.8288
o Close 0.8274
o PML 0.8096
o MTrend 0.8088
o M5 0.8038
Active traders can use PMH: 0.8325 as the pivot, maintaining a long position above that level and a flat or short position below it.
Summary
The power of technical analysis is in its ability to reduce multi-dimensional markets into a filtered two-dimensional space of price and time. Our methodology applies a consistent framework that identifies key measures of trend, distinct levels of support and resistance, and identification of potential trading ranges. Our methodology can be applied to any security or index, across markets, for which we can attain a reliable price history. We look forward to bringing you our unique brand of technical analysis and insight into many different markets. If you are a professional market participant and are open to discovering more, please connect with us. We are not asking for a subscription; we are asking you to listen.

Also Read


