


J. Brett Freeze and his firm Global Technical Analysis (GTA) provides RIA Pro subscribers Cartography Corner on a monthly basis. Brett’s analysis offers readers a truly unique brand of technical insight and risk framework. We personally rely on Brett’s research to help better gauge market trends, their durability, and support and resistance price levels.
GTA presents their monthly analysis on a wide range of asset classes, indices, and securities. At times the analysis may agree with RIA Pro technical opinions, and other times it will run contrary to our thoughts. Our goal is not to push a single view or opinion, but provide research to help you better understand the markets. Please contact us with any questions or comments. If you are interested in learning more about GTA’s services, please connect with them through the links provided in the article.
The link below penned by GTA provides a user’s guide and a sample of his analysis.
A Review of December
E-Mini S&P 500 Futures
We begin with a review of E-Mini S&P 500 Futures (ESZ9, ESH9) during December 2019. In our December 2019 edition of The Cartography Corner, we wrote the following:
In isolation, monthly support and resistance levels for December are:
- M4 3455.00
- M1 3255.00
- M3 3251.75
- M2 3211.00
- PMH 3155.00
- Close 3143.75
- PML 3033.00
- MTrend 3018.97
- M5 3011.00
Active traders can use 3155.00 as the pivot, whereby they maintain a long position above that level and a flat or short position below it.
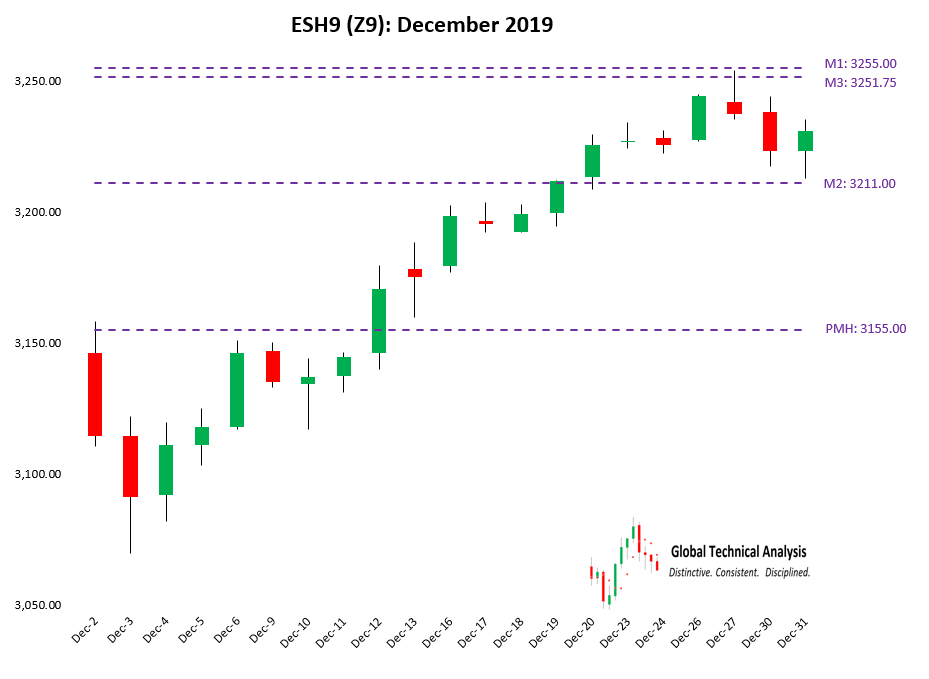
Figure 1 below displays the daily price action for December 2019 in a candlestick chart, with support and resistance levels isolated by our methodology represented as dashed lines. The first two trading sessions of December saw the market price extend the weakness which began on November 29. The low price for December was realized during the second trading session at 3069.50, -2.4% from November’s settlement.
Over the following seven trading sessions, the market price ascended, and settled, above our isolated pivot level at PMH: 3155.00. Over the following five sessions, the market price continued rising, and settled, above our next isolated resistance level at M2: 3211.00. On December 27th the high price for the month was realized at 3254.00, in between our clustered-resistance levels at M3: 3251.75 and M1: 3255.00.
The remainder of December was spent with the market price rotating back down to M2: 3211.00, now acting as support. Active traders following our analysis had the opportunity to capture a 3.03% profit.
Figure 1:
U.S. Ten-Year Note Futures
We continue with a review of U.S. Ten-Year Note Futures (“Tens”, TYH0) during December 2019. In our December 2019 edition of The Cartography Corner, we wrote the following:
In isolation, monthly support and resistance levels for December are:
- M4 131-30
- PMH 130-16
- MTrend 130-02
- Close 129-12
- M1 128-30
- M3 128-14
- PML 128-00
- M2 126-30
- M5 123-30
Active traders can use 130-16 as the pivot, whereby they maintain a long position above that level and a flat or short position below it.
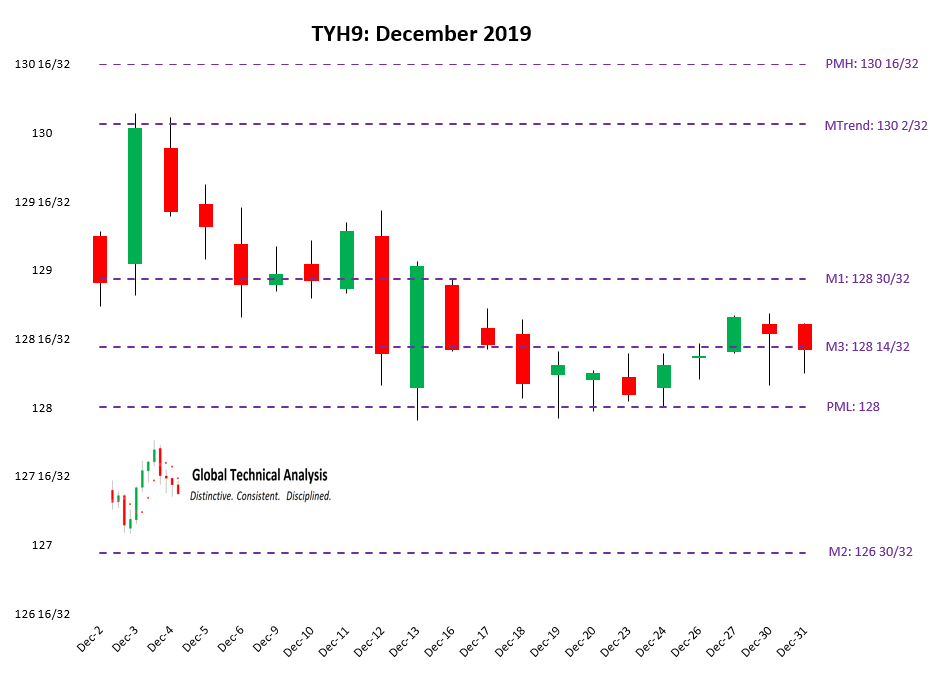
Figure 2 below displays the daily price action for December 2019 in a candlestick chart, with support and resistance levels isolated by our methodology represented as dashed lines. The second trading session saw the market price ascending, but not settling, above December’s Monthly Trend level at MTrend: 130-02. The high for the month was realized during that session which coincided with the low price realized by E-Mini S&P 500 Futures.
The following six trading sessions were spent with the market price descending to, and straddling, our isolated support level at M1: 128-30. On December 12th, the weakness accelerated and continued into the early hours of December 13th. During that session, the market price descended slightly below November’s low at PML: 128-00, realizing the low price for the month at 127-29, yet settled only one tick off the high of the session’s range. The remainder of December was spent with Tens essentially bound by M1: 128-30, M3: 128-14, and PML: 128-00.
Figure 2:
January 2020 Analysis
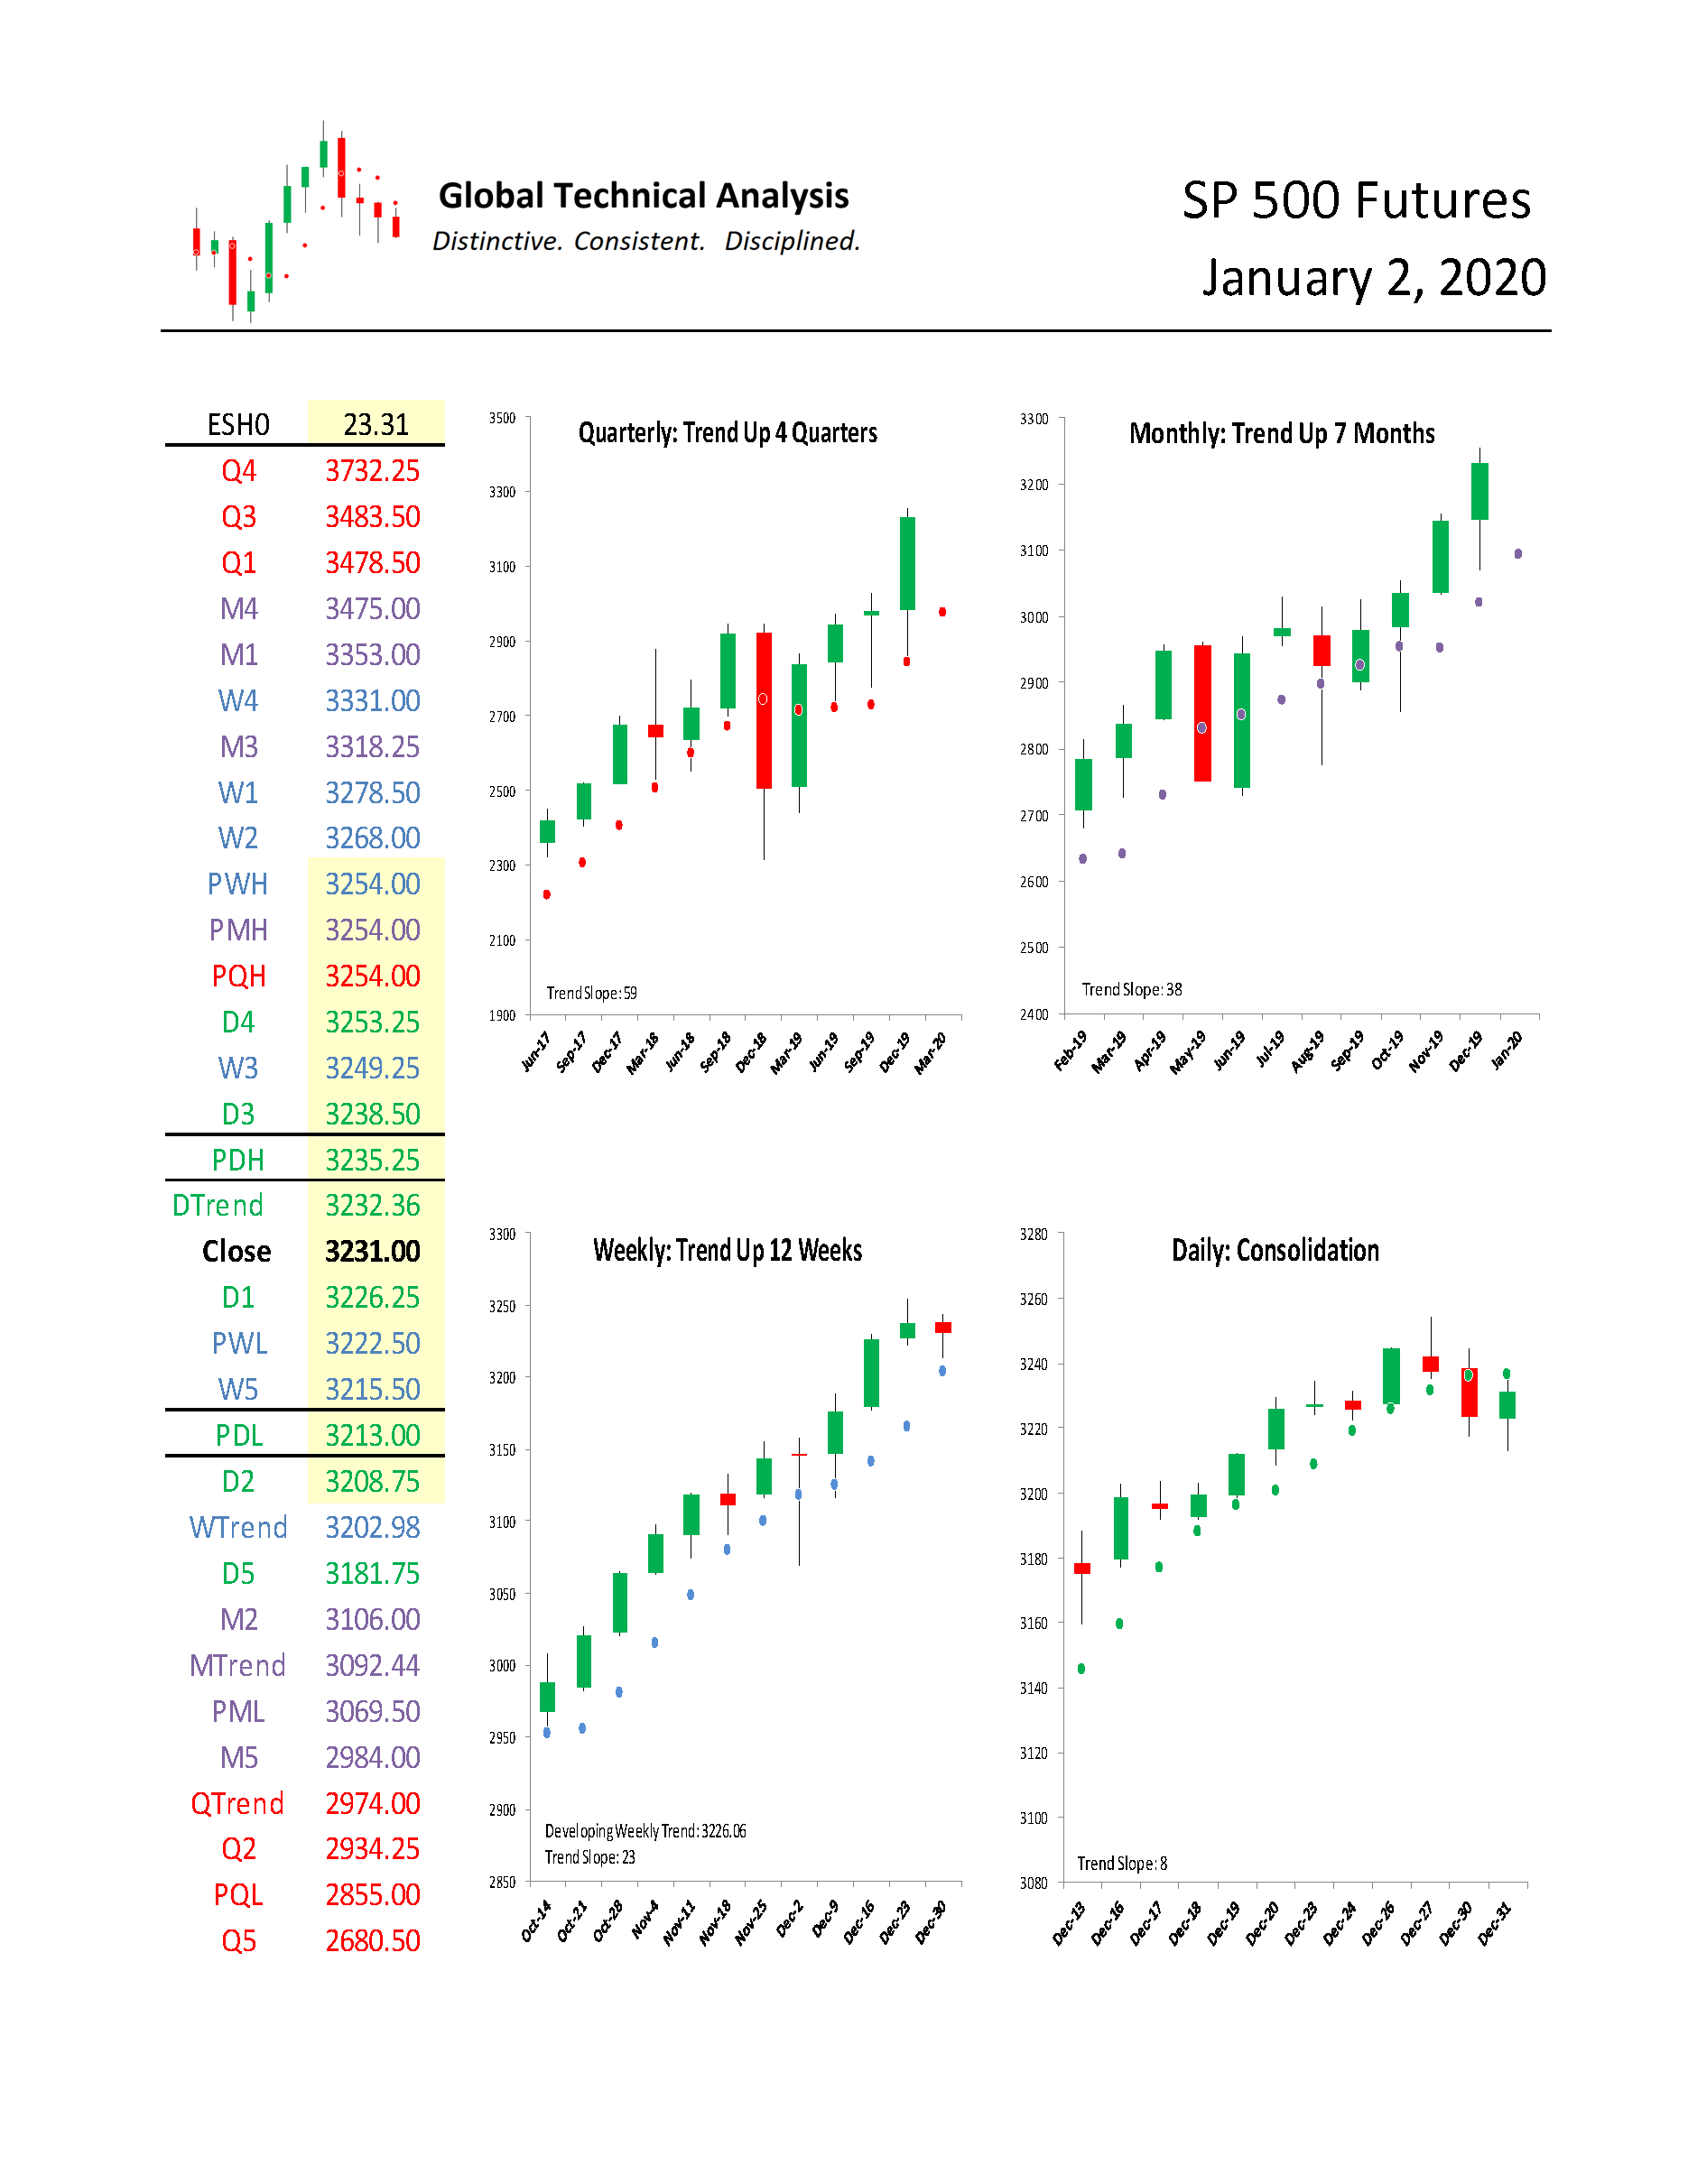
We begin by providing a monthly time-period analysis of E-Mini S&P 500 Futures (ESH0). The same analysis can be completed for any time-period or in aggregate.
Trends:
- Daily Trend 3232.36
- Current Settle 3231.00
- Weekly Trend 3202.98
- Monthly Trend 3092.44
- Quarterly Trend 2974.00
In the quarterly time-period, the chart shows that E-Mini S&P 500 Futures have been “Trend Up” for four quarters. Stepping down one time-period, the monthly chart shows that E-Mini S&P 500 Futures have been “Trend Up” for seven months. Stepping down to the weekly time-period, the chart shows that E-Mini S&P 500 Futures have been “Trend Up” for twelve weeks. The relative positioning of the Trend Levels is bullishly aligned. The market price is above all of them (with exception of Daily Trend) which is bullish as well.
The first indication of weakness will be a weekly settlement under Weekly Trend. As noted above, Weekly Trend is at WTrend: 3202.98 for this week and is currently developing at 3226.06 for the week of January 6th, 2020.
Support/Resistance:
In isolation, monthly support and resistance levels for January are:
- M4 3475.00
- M1 3353.00
- M3 3318.25
- PMH 3254.00
- Close 3231.00
- M2 3106.00
- MTrend 3092.44
- PML 3069.50
- M5 2984.00
Active traders can use 3254.00 as the pivot, whereby they maintain a long position above that level and a flat or short position below it.
Japanese Yen Futures
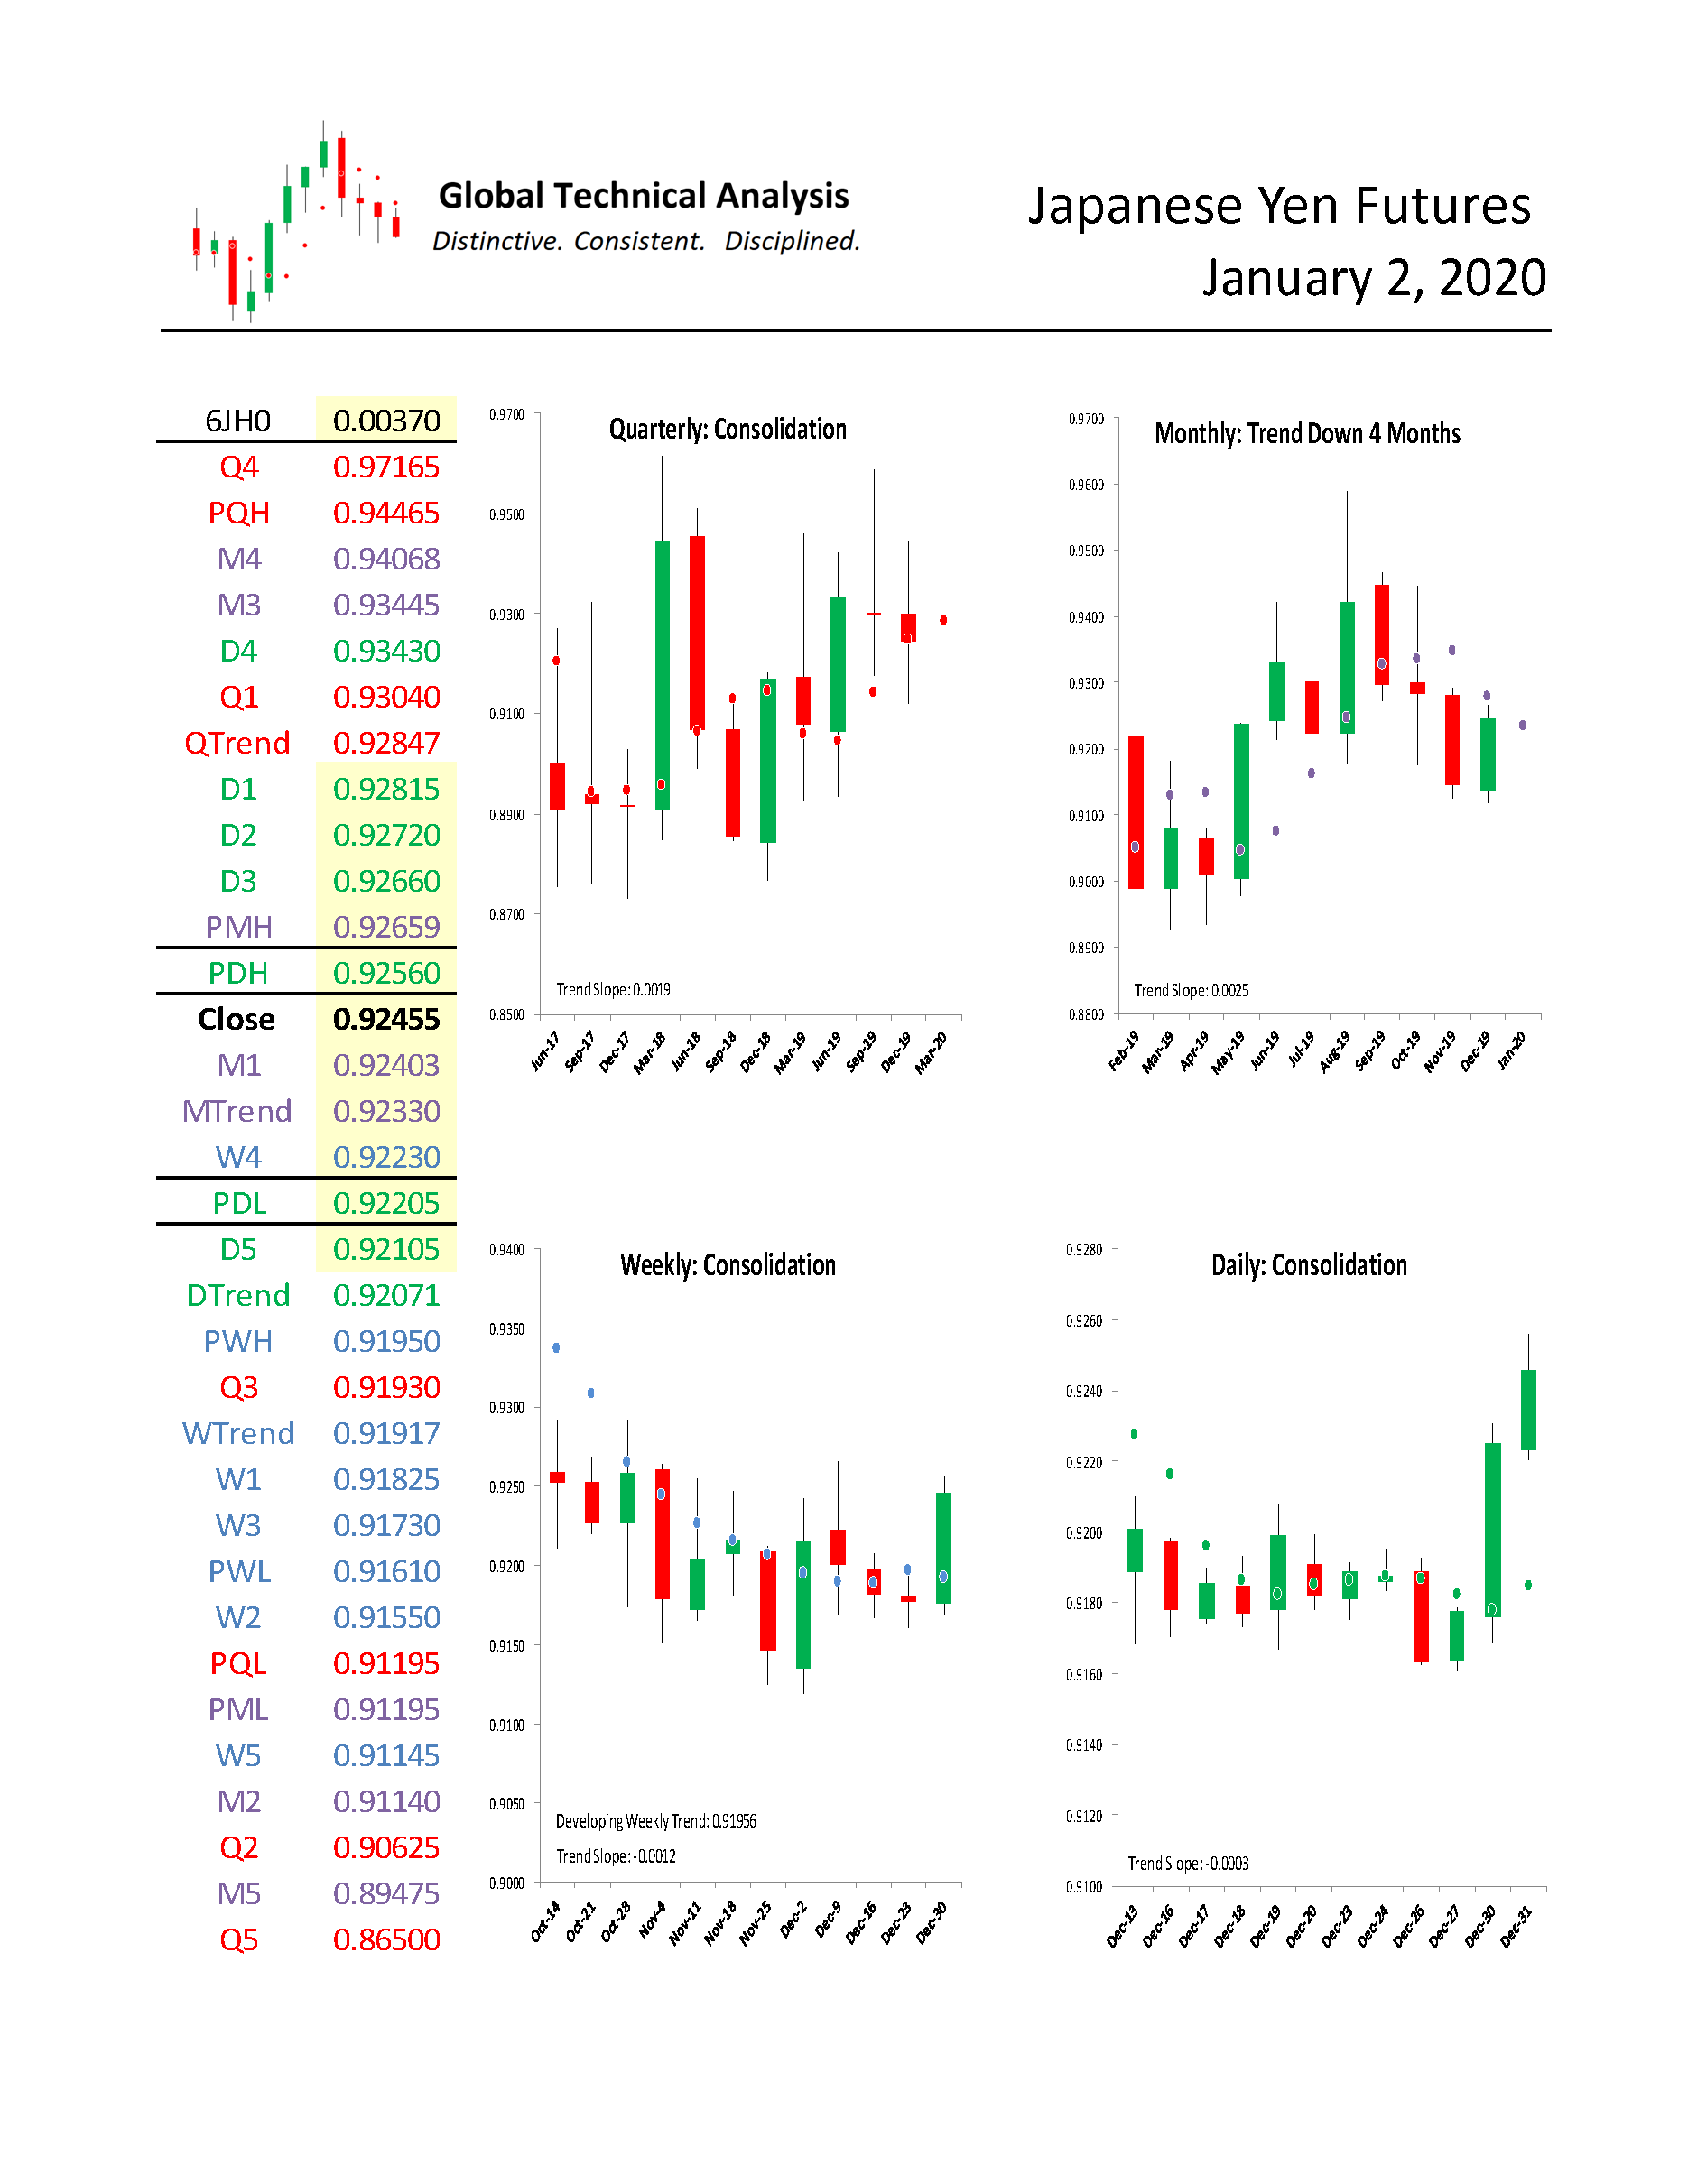
For the month of January, we focus on Japanese Yen Futures. Japanese Yen Futures are quoted with the Yen as the anchor currency. For example, a quote of 0.92000 means 1 Yen is worth ninety-two cents. A rising Yen is equivalent to a weaker U.S. dollar. We provide a monthly time-period analysis of 6JH0. The same analysis can be completed for any time-period or in aggregate.
Trends:
- Quarterly Trend 0.92847
- Current Settle 0.92455
- Monthly Trend 0.92330
- Daily Trend 0.92071
- Weekly Trend 0.91917
As can be seen in the quarterly chart below, the Yen is in “Consolidation” after having been “Trend Up” for four quarters. Stepping down one time-period, the monthly chart shows that the Yen has been “Trend Down” for four months. Stepping down to the weekly time-period, the chart shows that the Yen is in “Consolidation”.
With the intermediate and short-term trend levels having quietly slipped beneath the market price, it is worth considering that the importance of the Yen as a barometer of other asset classes is hard to overstate. Might the yen be an omen of change in other asset markets? Please consider the following annual correlations of daily returns between Japanese Yen Futures and other asset classes (futures):
Equity -0.53, Treasury (Price) 0.70, U.S. Dollar Index -0.46, Gold 0.51
Support/Resistance:
In isolation, monthly support and resistance levels for January are:
- M4 0.94068
- M3 0.93445
- PMH 0.92659
- Close 0.92455
- M1 0.92403
- MTrend 0.92330
- PML 0.91195
- M2 0.91140
- M5 0.89475
Active traders can use 0.92659 as the upside pivot, whereby they maintain a long position above that level. Active traders can use 0.92330 as the downside pivot, whereby they maintain a flat or short position below that level.
Summary
The power of technical analysis is in its ability to reduce multi-dimensional markets into a filtered two-dimensional space of price and time. Our methodology applies a consistent framework that identifies key measures of trend, distinct levels of support and resistance, and identification of potential trading ranges. Our methodology can be applied to any security or index, across markets, for which we can attain a reliable price history. We look forward to bringing you our unique brand of technical analysis and insight into many different markets. If you are a professional market participant and are open to discovering more, please connect with us. We are not asking for a subscription; we are asking you to listen.


Also Read


