


J. Brett Freeze and his firm Global Technical Analysis (GTA) provides RIA Pro subscribers Cartography Corner on a monthly basis. Brett’s analysis offers readers a truly unique brand of technical insight and risk framework. We personally rely on Brett’s research to help better gauge market trends, their durability, and support and resistance price levels.
GTA presents their monthly analysis on a wide range of asset classes, indices, and securities. At times the analysis may agree with RIA Pro technical opinions, and other times it will run contrary to our thoughts. Our goal is not to push a single view or opinion, but provide research to help you better understand the markets. Please contact us with any questions or comments. If you are interested in learning more about GTA’s services, please connect with them through the links provided in the article.
The link below penned by GTA provides a user’s guide and a sample of his analysis.
November 2020 Review
E-Mini S&P 500 Futures
We begin with a review of E-Mini S&P 500 Futures (ESZ0) during November 2020. In our November 2020 edition of The Cartography Corner, we wrote the following:
In isolation, monthly support and resistance levels for November are:
o M4 3884.00
o PMH 3541.00
o M1 3499.40
o MTrend 3382.40
o Close 3264.75
o M2 3252.00
o PML 3225.00
o M3 3177.50
o M5 2867.40
Active traders can use MTrend: 3382.40 as the pivot, maintaining a long position above that level and a flat or short position below it.
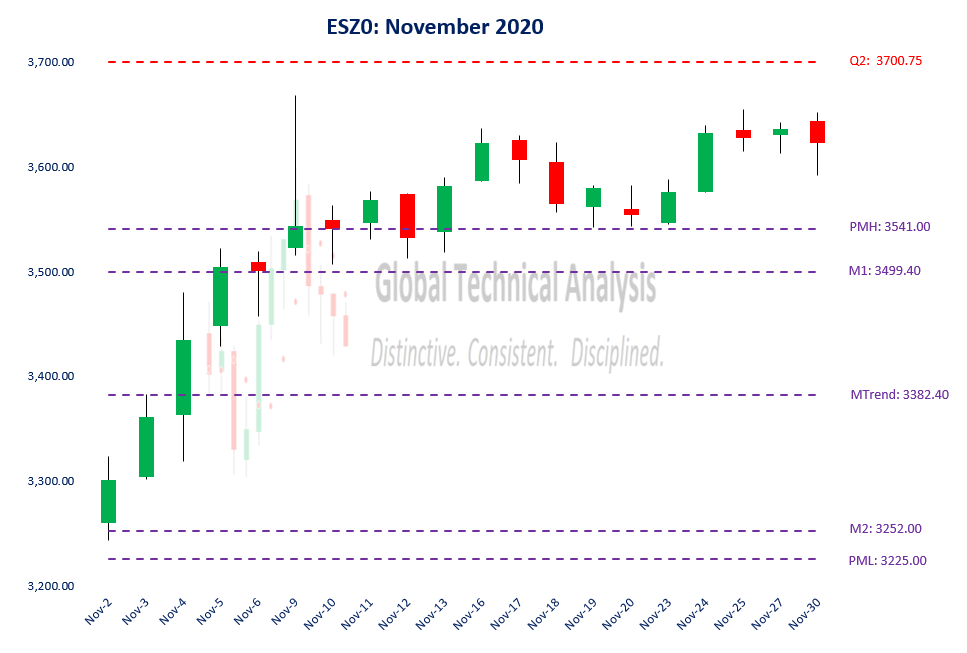
Figure 1 below displays the daily price action for November 2020 in a candlestick chart, with support and resistance levels isolated by our methodology represented as dashed lines. After briefly testing (intra-session) our first isolated support level at M2: 3252.00, the market price ascended 424.75 points (13%) over the first six trading sessions of November. No one, including the esteemed members of Congress, could have had prior knowledge of the November 9th Pfizer COVID-19 vaccine announcement. Even if they did, no market participant would trade on material non-public information, for that is illegal. Color me skeptical. The following fourteen trading sessions saw the market price oscillate essentially within the 152.25-point trading range of November 9th. That range being bound by 3668.00 on the upside and 3515.75 on the downside.
Upon closer inspection, one can see that our isolated resistance levels were “respected” within that seemingly chaotic rally. The high on November 3rd occurred right at Monthly Trend, with the market price backing away from Monthly Trend into the close. On November 5th and 6th, the market price settled on top of M1: 3499.40, with the intra-session highs occurring within our clustered-resistance levels of M1: 3499.40 / PMH: 3541.00. The high on November 9th stopped short of isolated quarterly resistance at Q2: 3700.75. Our analysis “mapped” the rally well.
Figure 1:
High-Grade Copper Futures
We continue with a review of High-Grade Copper Futures (HGZ0) during November 2020. In our November 2020 edition of The Cartography Corner, we wrote the following:
In isolation, monthly support and resistance levels for November are:
o M4 3.5225
o M1 3.3150
o PMH 3.2180
o M3 3.0625
o Close 3.0475
o MTrend 3.0087
o PML 2.8345
o M2 2.7555
o M5 2.5480
Active traders can use MTrend: 3.0087 as the pivot, maintaining a long position above that level and a flat or short position below it.
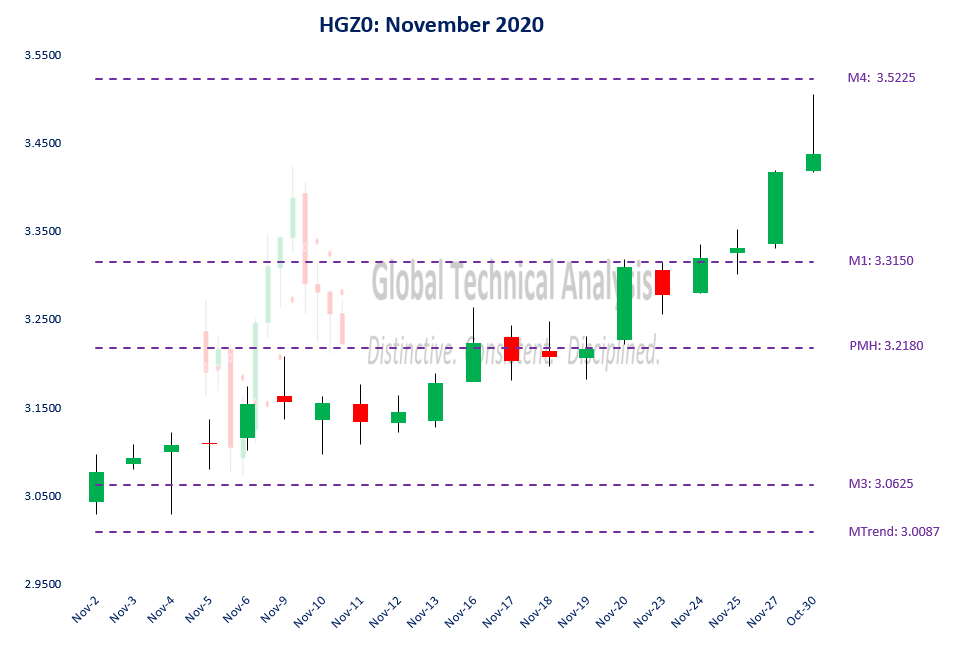
Figure 2 below displays the daily price action for November 2020 in a candlestick chart, with support and resistance levels isolated by our methodology represented as dashed lines. Our isolated pivot level was never tested. The month of November began with the market price settling above our first resistance level at M3: 3.0625.
The following ten trading sessions saw the market price ascend to our next resistance level at PMH: 3.2180. After consolidating for three trading sessions, the ascent continued with the market price gapping up to our next isolated resistance level at M1: 3.3150. After consolidating for two trading sessions, the market price continued higher with its next target being our Monthly Upside Exhaustion level at M4: 3.5225. However, the rally stopped short of that level with the high for November being realized on November 30th at 3.5050.
Conservatively, active traders following our analysis realized a gain of 11.7%.
Figure 2:
December 2020 Analysis
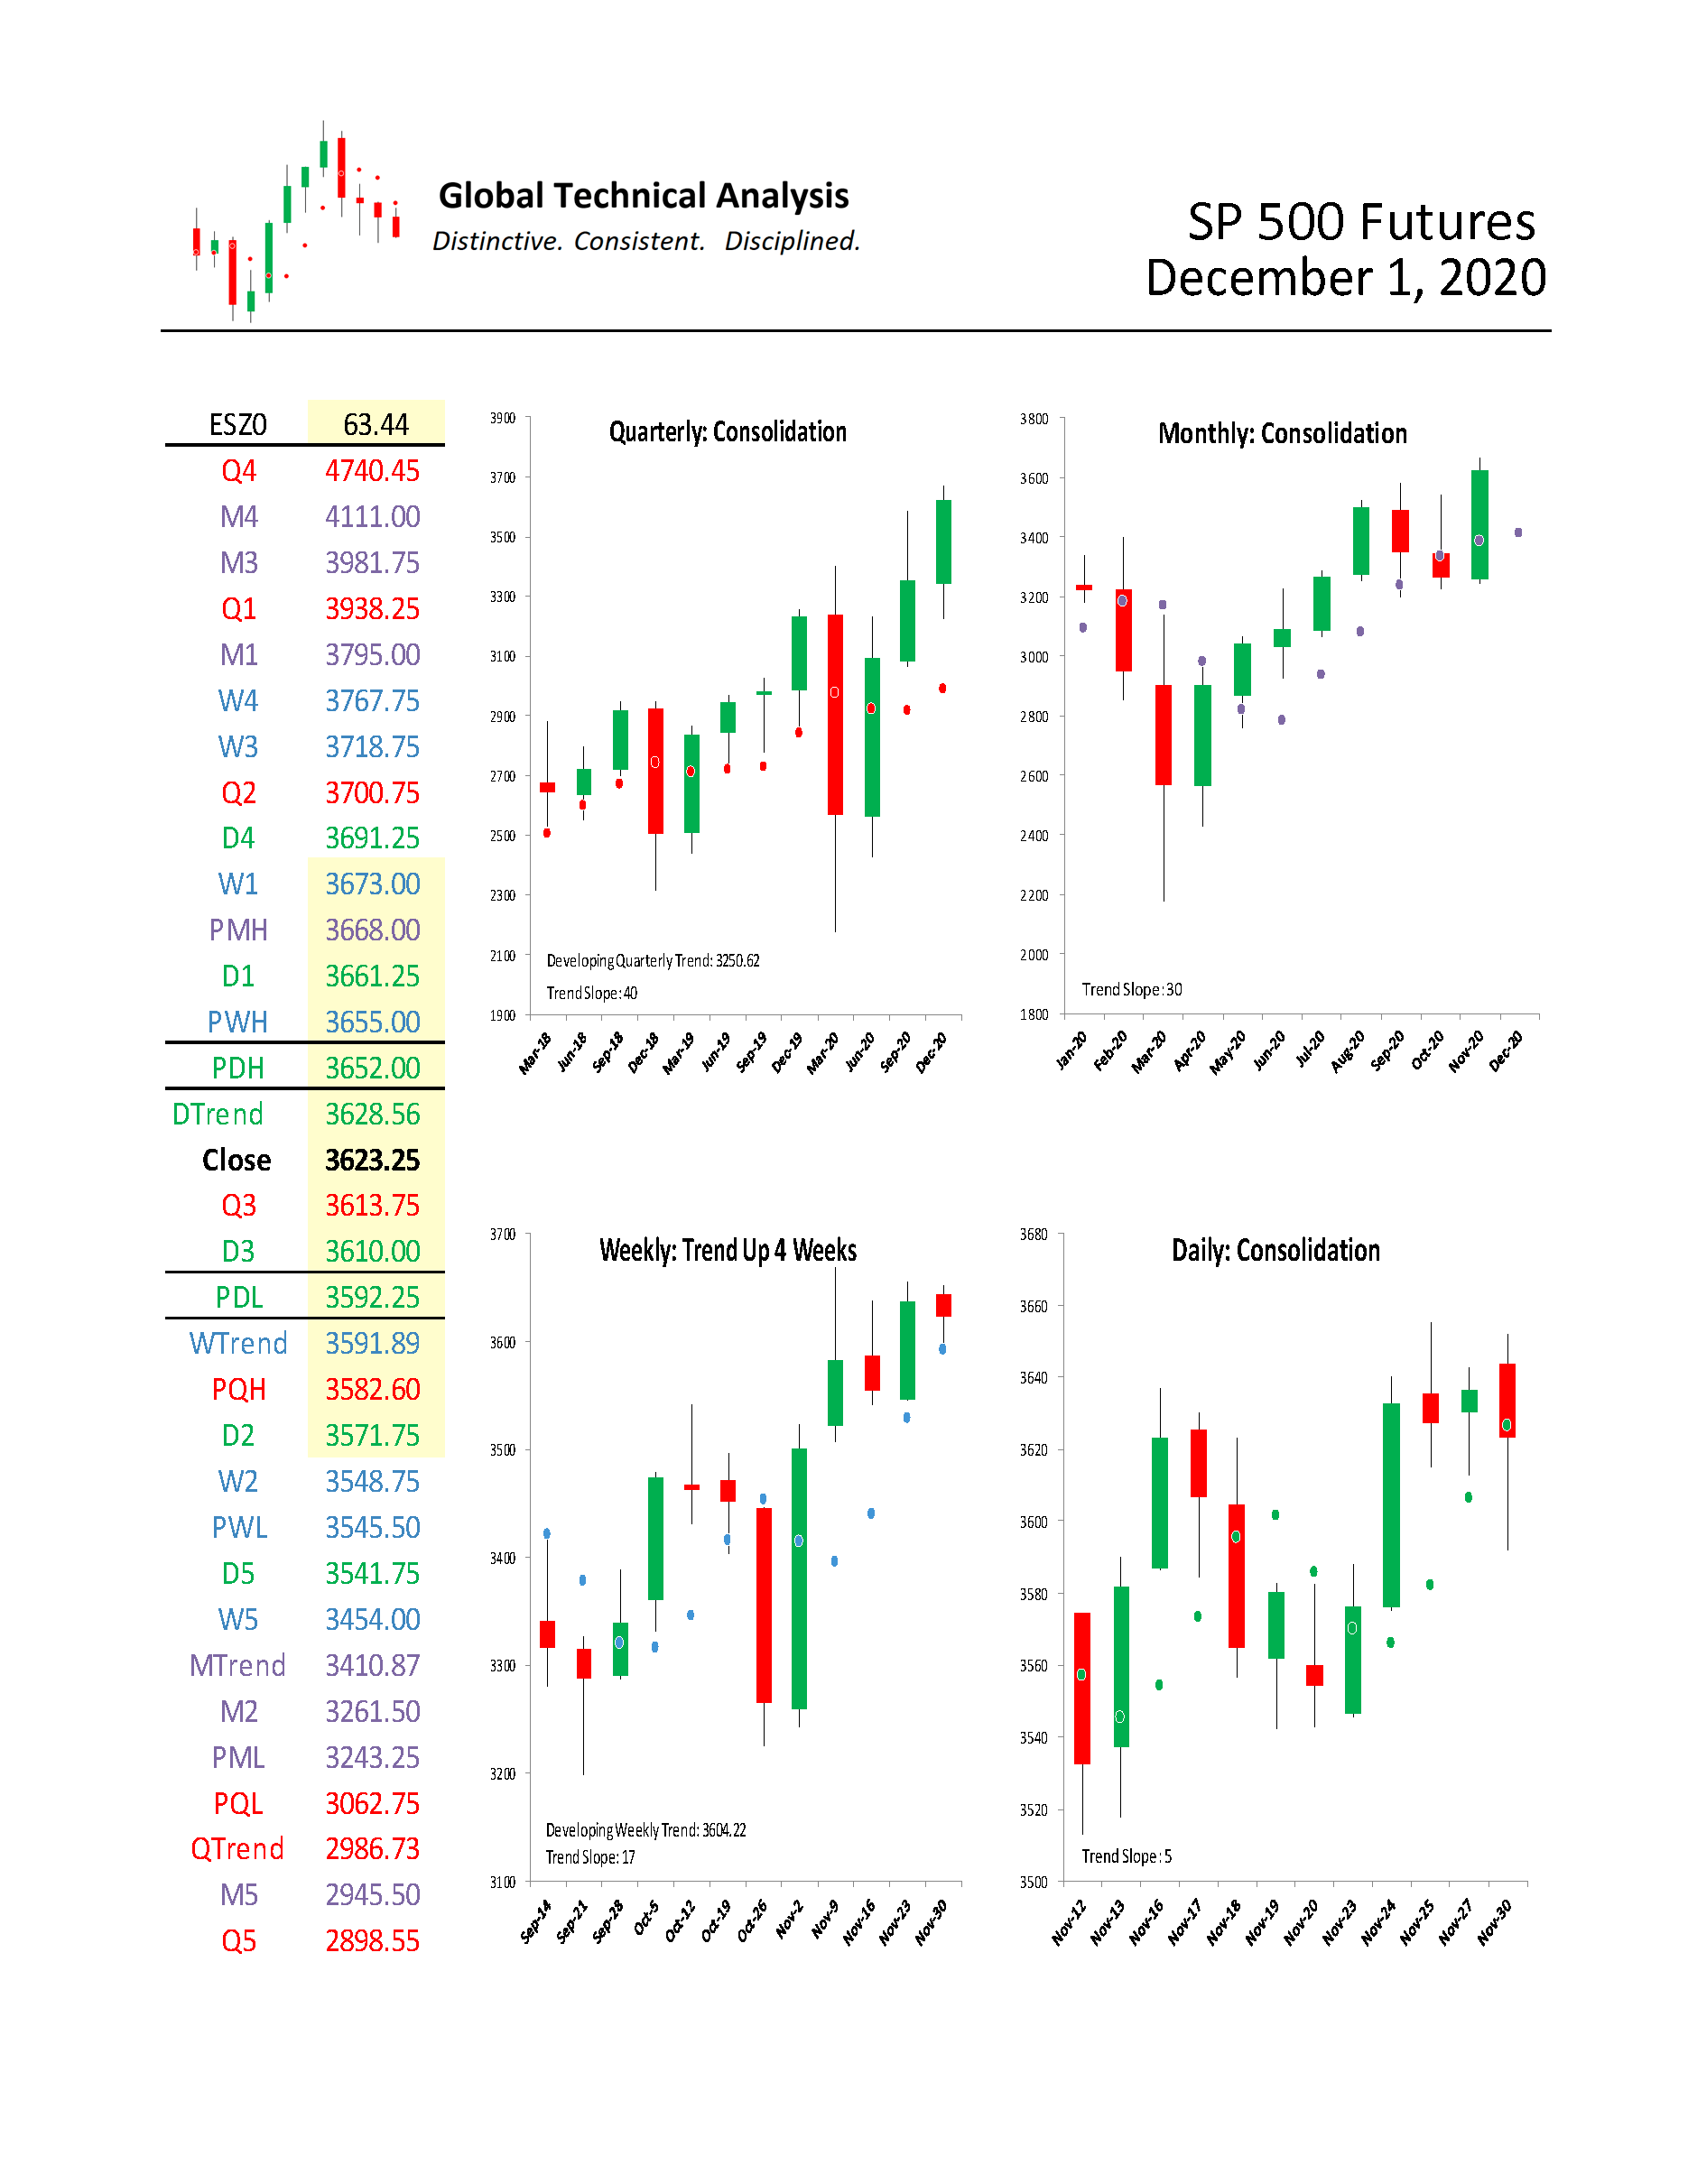
We begin by providing a monthly time-period analysis of E-Mini S&P 500 Futures (ESZ0). The same analysis can be completed for any time-period or in aggregate.
Trends:
o Daily Trend 3628.56
o Current Settle 3623.25
o Weekly Trend 3591.89
o Monthly Trend 3410.87
o Quarterly Trend 2986.73
The relative positioning of the Trend Levels is bullish. Think of the relative positioning of the Trend Levels like you would a moving-average cross; the Trend Levels are higher as the time-periods. In the quarterly time-period, the chart shows that E-Mini S&P 500 Futures are in “Consolidation”, after having been “Trend Up” for four quarters. Stepping down one time-period, the monthly chart shows that E-Mini S&P 500 Futures are in “Consolidation”, after having settled six of the previous seven months above Monthly Trend. Stepping down to the weekly time-period, the chart shows that E-Mini S&P 500 Futures have been “Trend Up” for four weeks.
One rule we have is to anticipate a two-period high (low), within the following four to six periods, after a Downside (Upside) Exhaustion level has been reached. The two-period high that we were anticipating in the weekly time-period was achieved during the week of November 9th. A new signal was given during the week of November 2nd for us to anticipate a two-week low to occur over the next four to six weeks. To be achieved this week, a trade below 3542.25 is required. The two-period high that we were anticipating in the monthly time-period was achieved during November.
Support/Resistance:
In isolation, monthly support and resistance levels for December are:
o M4 4111.00
o M3 3981.75
o M1 3795.00
o PMH 3668.00
o Close 3623.25
o MTrend 3410.87
o M2 3261.50
o PML 3243.25
o M5 2945.50
Active traders can use PMH: 3668.00 as the pivot, maintaining a long position above that level and a flat or short position below it.
E-Mini Russell 2000 Futures
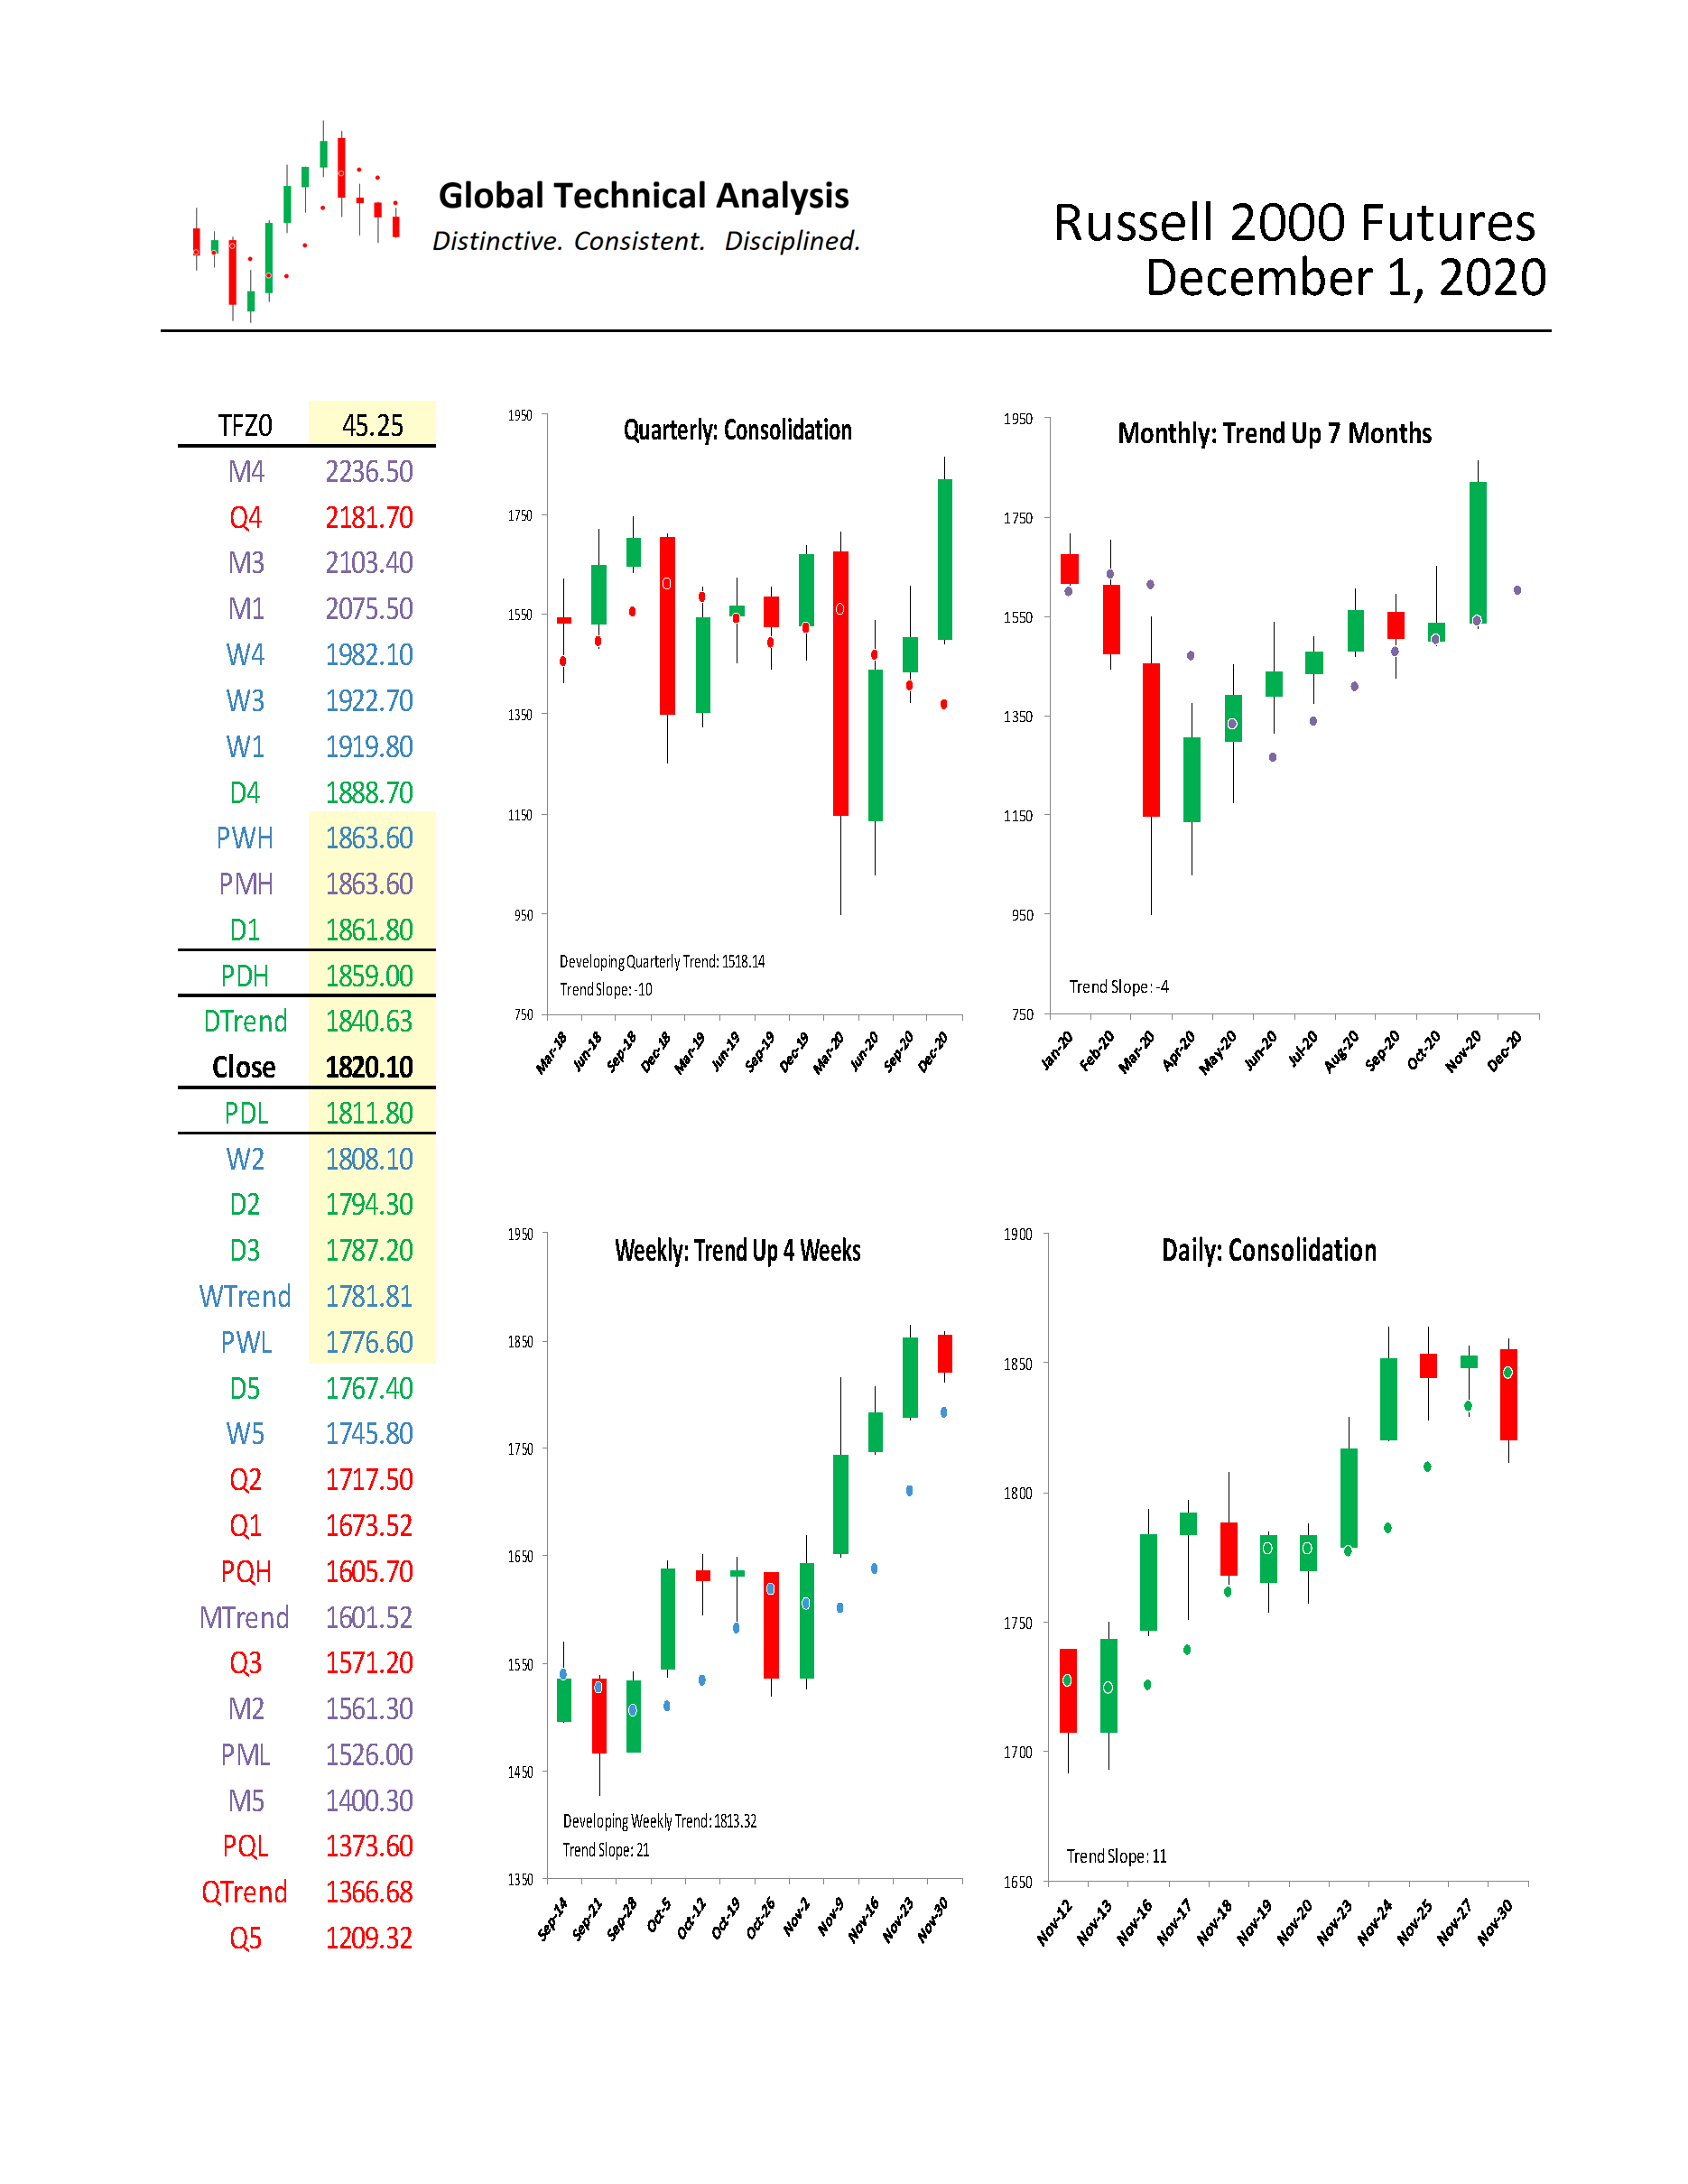
For December, we focus on E-Mini Russell 2000 Futures. We provide a monthly time-period analysis of TFZ0. The same analysis can be completed for any time-period or in aggregate.
Trends:
o Daily Trend 1840.63
o Current Settle 1820.10
o Weekly Trend 1781.81
o Monthly Trend 1601.52
o Quarterly Trend 1366.68
The relative positioning of the Trend Levels is bullish. Think of the relative positioning of the Trend Levels like you would a moving-average cross; the Trend Levels are higher as the time-periods decrease. As can be seen in the quarterly chart below, E-Mini Russell 2000 Futures are in “Consolidation”. Stepping down one time-period, the monthly chart shows that E-Mini Russell 2000 Futures have been “Trend Up” for seven months. Stepping down to the weekly time-period, the chart shows that E-Mini Russell 2000 Futures have been “Trend Up” for four weeks.
One rule we have is to anticipate a two-period high (low), within the following four to six periods, after a Downside (Upside) Exhaustion level has been reached. A new signal was given during the week of November 9th for us to anticipate a two-week low to occur over the next four to six weeks. To be achieved this week, a trade below 1745.10 is required. The two-period high that we were anticipating in the monthly time-period was achieved during November.
Support/Resistance:
In isolation, monthly support and resistance levels for December are:
o M4 2236.50
o M3 2103.40
o M1 2075.50
o PMH 1863.60
o Close 1820.10
o MTrend 1601.52
o M2 1561.30
o PML 1526.00
o M5 1400.30
Active traders can use PMH: 1863.60 as the pivot, maintaining a long position above that level and a flat or short position below it.
Summary
The power of technical analysis is in its ability to reduce multi-dimensional markets into a filtered two-dimensional space of price and time. Our methodology applies a consistent framework that identifies key measures of trend, distinct levels of support and resistance, and identification of potential trading ranges. Our methodology can be applied to any security or index, across markets, for which we can attain a reliable price history. We look forward to bringing you our unique brand of technical analysis and insight into many different markets. If you are a professional market participant and are open to discovering more, please connect with us. We are not asking for a subscription; we are asking you to listen.

Also Read


