


In this issue of “Bulls Continue To Push Stocks Higher As Risk Rises.”
- Bulls Push Stocks To New Highs
- Market Queuing Up For A Correction
- The Fed Broke It
- Portfolio Positioning
- The Illusion Of Soaring Savings Amid Rising Economic Uncertainty
- Sector & Market Analysis
- 401k Plan Manager
Follow Us On: Twitter, Facebook, Linked-In, Sound Cloud, Seeking Alpha
RIA Advisors Can Now Manage Your 401k Plan
Too many choices? Unsure of what funds to select? Need a strategy to protect your retirement plan from a market downturn?
RIA Advisors can now manage your 401k plan for you. It’s quick, simple, and transparent. In just a few minutes, we can get you in the “right lane” for retirement.

Catch Up On What You Missed Last Week

Bulls Push Stocks To New Highs
What better way to celebrate a new President than to push stocks to new all-time highs? On Wednesday, the market surged as Joe Biden got sworn in as the 46th President of the United States. Interestingly, it was a rotation from the reflation trade back into the “Old Gaurd” of the FANG stocks that led the way.
In fact, despite hopes that the reflation trade would be the thing, it has been just the opposite. The chart below is the differential in performance over the last week between market-cap and equal-weighted markets. (FANG dominates market cap whereas equal-weight has a much larger weighting in industrials)
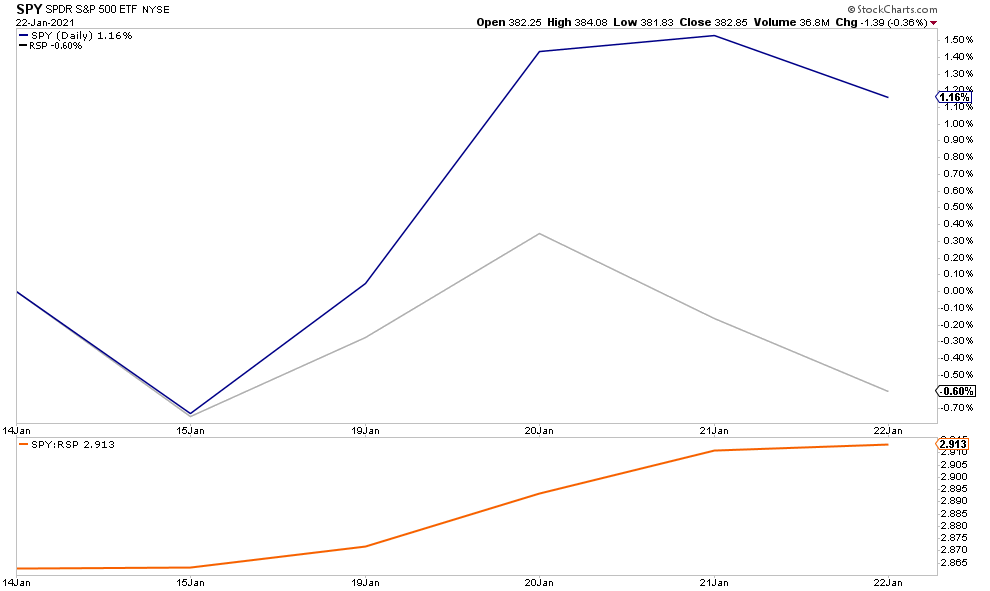
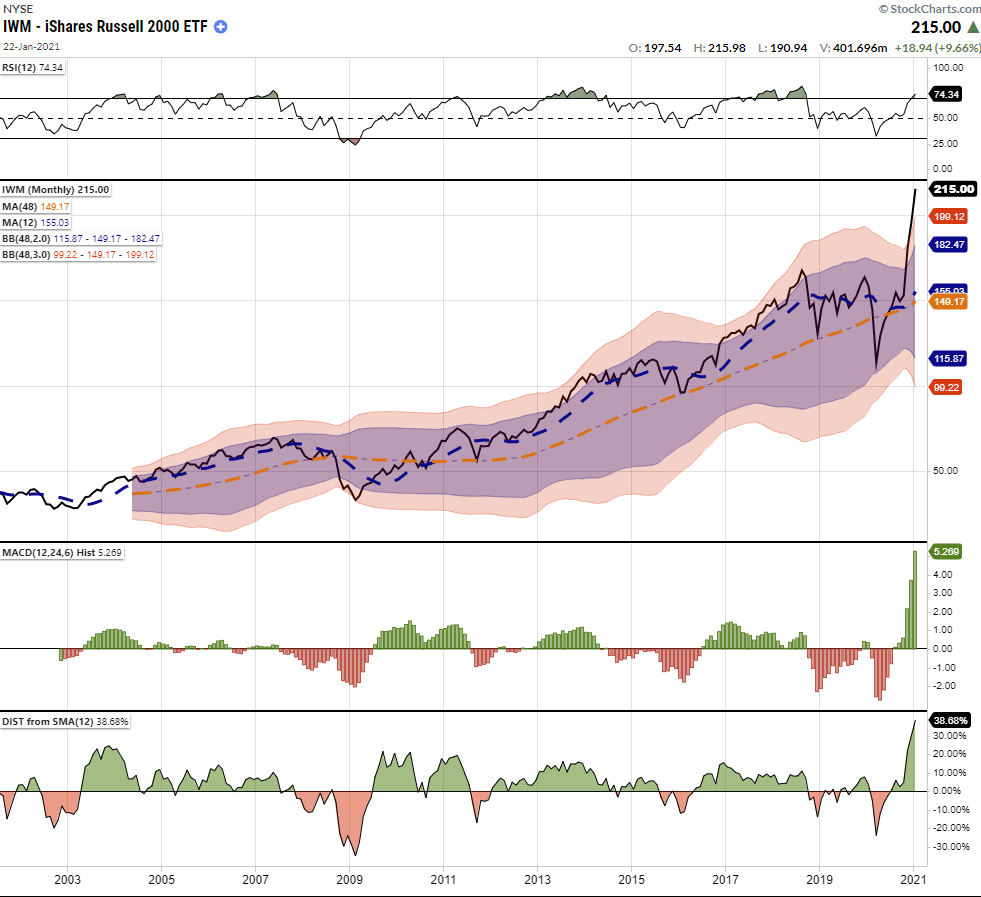
Notably, that rotation is a function of money managers repositioning portfolios to reduce risk. The risk gets reduced by moving from significantly extended and deviated areas of the market back to less extended or oversold segments. As noted last week, there is nothing screaming risk more at the moment than the small-cap sector.
Markets Queuing Up For A Correction
Currently, managers can’t afford to be out of the market and potentially suffer a performance drag. So, the rotation in the market reduces risk while still maintaining exposure to equities. However, as discussed last week, there is ample evidence that “everyone is currently in the pool.” Such leaves the market vulnerable to three risks:
- More stimulus and direct checks into the economy lead to an inflationary spike that causes the Fed to discuss hiking rates and tapering QE.
- The current rise in interest rates continues over higher inflation concerns until it impacts a debt-laden economy causing the Fed to implement “yield curve control.”
- The dollar, which has an enormous net-short position against it, reverses moves higher, pulling in foreign reserves, causing a short-squeeze on the dollar.
The reality is that both a rise in the dollar, with higher yields, is likely to start attracting reserves from countries faced with economic weakness and negative-yielding debt. Such would quickly reverse the tailwinds that have supported the equity rally since March.
In the following video, we discuss why the markets are setting up for a correction over the next month of 3-5%. (We publish a daily 3-minute video click here to subscribe)
Important Note: A correction can take on one of two forms. The market either declines in price to alleviate the overbought condition, or it can consolidate sideways.

The Fed Broke It
In his latest letter to investors, The Financial Times reported that Seth Klarman of Baupost Capital blamed the world’s central banks for flooding the financial system with liquidity masking the US economy’s real health. To wit:
“With so much stimulus being deployed, trying to figure out if the economy is in recession is like trying to assess if you had a fever after you just took a large dose of aspirin. But as with frogs in water that is slowly being heated to a boil, investors are being conditioned not to recognise the danger.”
While the entire article is worth a read, his point is what we addressed previously in “Moral Hazard.” What exactly is the definition of “moral hazard.”
Noun – ECONOMICS
“The lack of incentive to guard against risk where one is protected from its consequences, e.g., by insurance.”
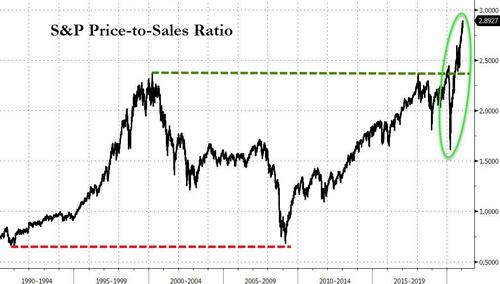
Take a look at the following chart, which is a clear example of investors adopting the idea of “insurance” against loss. (Charts courtesy of ZeroHedge)
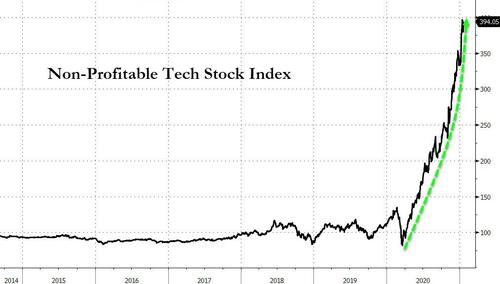
Of course, given the price-to-sales ratio is at a record high, such also suggests that investors are vastly overpaying for future outcomes. When there is a lack of perceived risk, the outcome has always ended poorly without exception.
More Of The Same
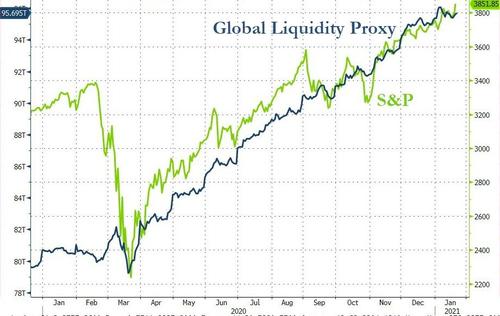
As Seth Klarman notes, it is the unprecedented flood of global liquidity that is driving the mayhem.
“The Fed’s policies and programs have directly contributed to exceptionally benign market conditions where nearly everything is bid up while downside volatility is truncated.”
While The Fed’s drastic measures have arguably helped to boost economic activity and rescue ailing businesses (or more correctly, raise stock prices enabling issuance and collapse yields and spreads enabling issuance), Klarman warns:
“They have also kindled two dangerous ideas: that fiscal deficits don’t matter, and that no matter how much debt is outstanding, we can effortlessly, safely, and reliably pile on more.”
Unfortunately, 40-years of history have already shown us the problem with debts and deficits in economic prosperity for the masses.
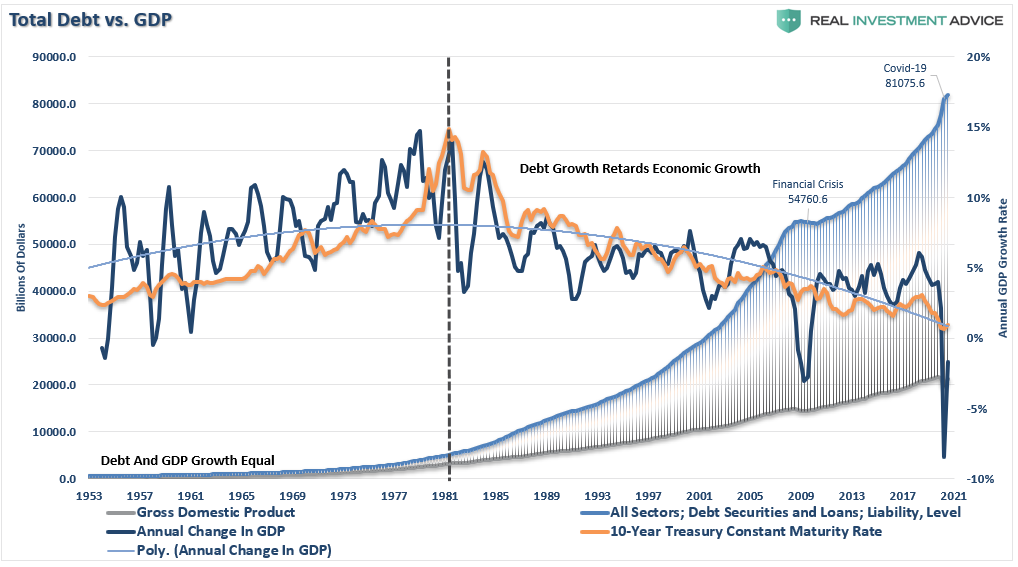
Another decade of the same should about finish the job.

Signs Of Enthusiasm
Sentiment Trader had a great piece out on Thursday discussing sentiment and enthusiasm.
“The biggest challenge with this market, one we haven’t really ever had to deal with before, is the conflict between an impressive recovery from a historic selloff, superimposed against a backdrop of record levels of speculative activity.
Recoveries from a bear market typically take much longer. By the time they’ve recovered and been at new highs for a while, speculation comes in, markets plateau, divergences form, and sentiment cycles back down during a correction.
If we look at a typical Sentiment Cycle, then we basically went from enthusiasm to panic and right back to enthusiasm, all in record time.”
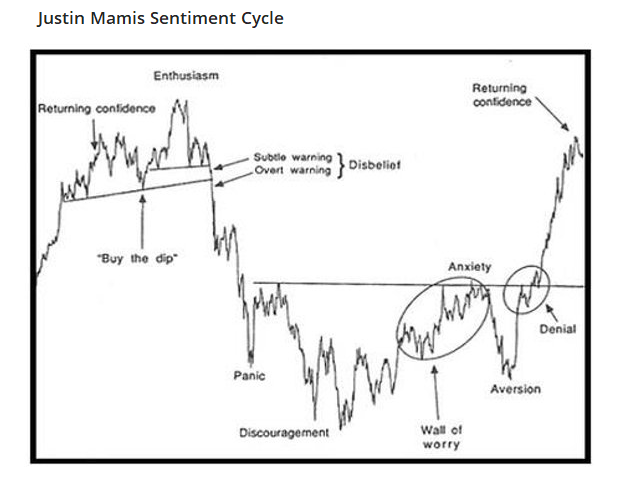
“There is little arguing that we’re in this part of the cycle. As the Knowledge Base article, “How do I use sentiment?” points out, this part of the cycle is identified by:
- High optimism – CHECK
- Easy credit (too easy, with loose terms) – CHECK
- A rush of initial and secondary offerings –CHECK
- Risky stocks outperforming – CHECK
- Stretched valuations – CHECK
All boxes are checked there. More objectively, when we look at the correlation between the S&P 500’s price path lately versus the Enthusiasm phase of past cycles, there is a high positive correlation.”
Investors Are There
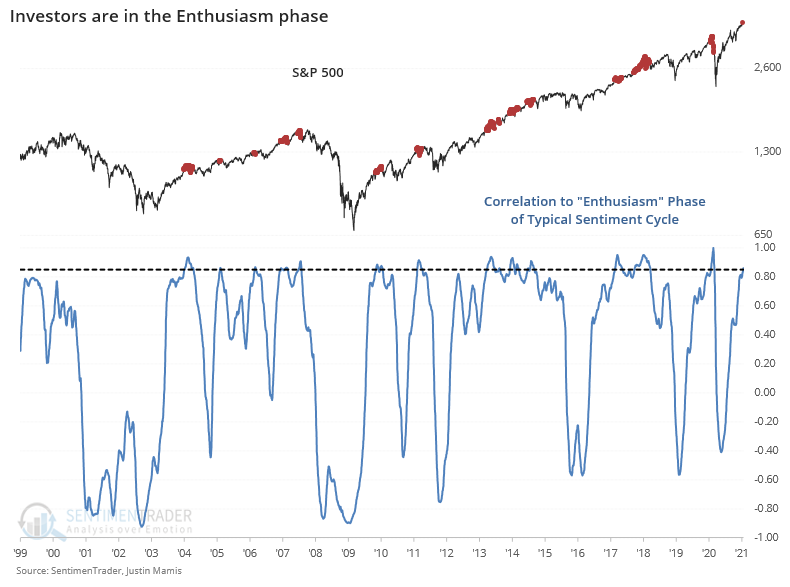
While none of this suggests the markets are about to crash, it does indicate that short-term risk/reward is not favorable currently. As SentimenTrader summed up:
“Sentiment is horrifically extreme and almost all signs are present, screaming at us that we’re seeing the kinds of behavior that are almost solely and universally seen at medium-term peaks in stocks.”
As noted above, a short- to intermediate-term correction to reduce current levels of exuberance would be a healthy thing. Longer-term, the dynamics to support a continuation of the bull market will become more challenging, particularly if inflation and interest rates start to push higher.

Portfolio Positioning – A Correction Is Coming
As noted, a correction is coming.
Let me clarify. I am NOT saying the markets are about to crash.
However, after the recent runup from November, all of our indicators are beginning to align. Such suggests a 3-7% correction over the next month. Could it be 10% or more? Absolutely. Once the correction begins, we can garner a better understanding of the downside risk.
Over the past year, we have remained primarily allocated toward equity exposure but have also worked around the edges hedging risk, raising stop levels, and staying mostly domestic-focused. Given our outlook for a steeper yield curve earlier this year, we also shortened the duration of our bond allocations and increased credit quality.
On Friday, we did increase our cash levels and reduce our equity-index longs for the time being. We may be a bit early, but we feel the risk currently outweighs the reward. These portfolio adjustments to allocations follow our time-tested portfolio management rules.
- Tighten up stop-loss levels to current support levels for each position.
- Hedge portfolios against major market declines.
- Take profits in positions that have been big winners
- Sell laggards and losers
- Raise cash and rebalance portfolios to target weightings.
Notice, nothing in there says, “sell everything and go to cash.”
Our Job As Investors
Remember, our job as investors is pretty simple – protect our investment capital from short-term destruction so that we can play the long-term investment game.
- Capital preservation
- A rate of return sufficient to keep pace with the rate of inflation.
- Expectations based on realistic objectives. (The market does not compound at 8%, 6% or 4%)
- Higher rates of return require an exponential increase in the underlying risk profile. This tends to not work out well.
- You can replace lost capital – but you can’t replace lost time. Time is a precious commodity that you cannot afford to waste.
- Portfolios are time-frame specific. If you have a 5-years to retirement but build a portfolio with a 20-year time horizon (taking on more risk) the results will likely be disastrous.
With forward returns likely to be lower and more volatile than witnessed over the last decade, the need for a more conservative approach is rising. Controlling risk, reducing emotional investment mistakes, and limiting investment capital’s destruction will likely be the real formula for investment success in the coming decade.

The MacroView
If you need help or have questions, we are always glad to help. Just email me.
See You Next Week
By Lance Roberts, CIO
Market & Sector Analysis
Analysis & Stock Screens Exclusively For RIAPro Members
S&P 500 Tear Sheet
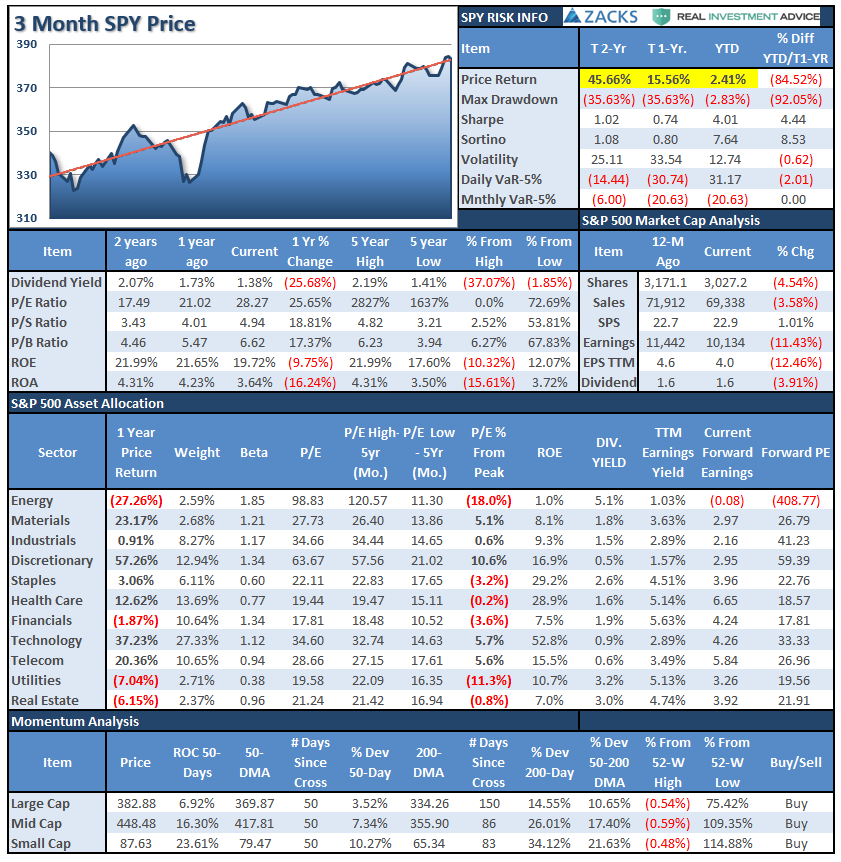
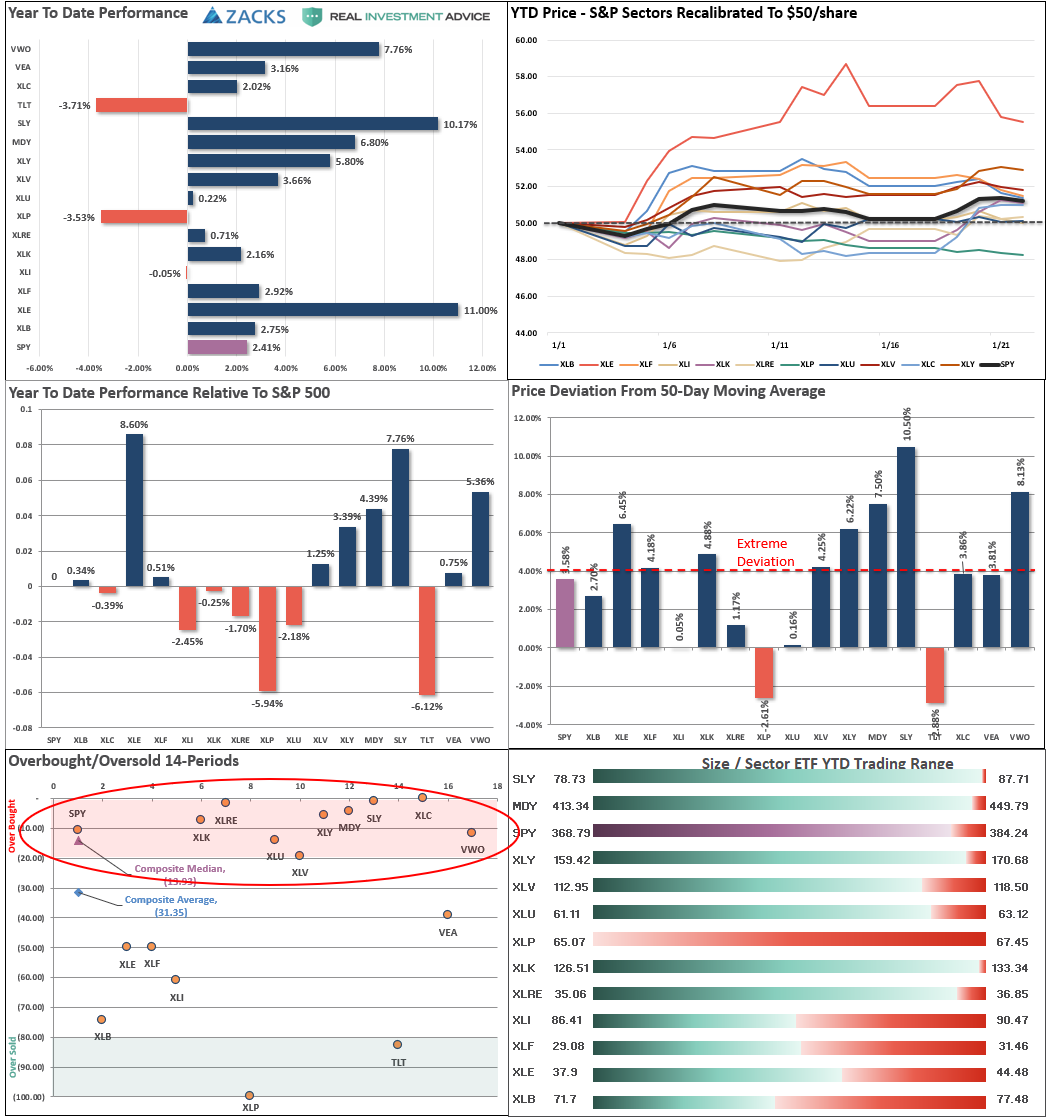
Performance Analysis
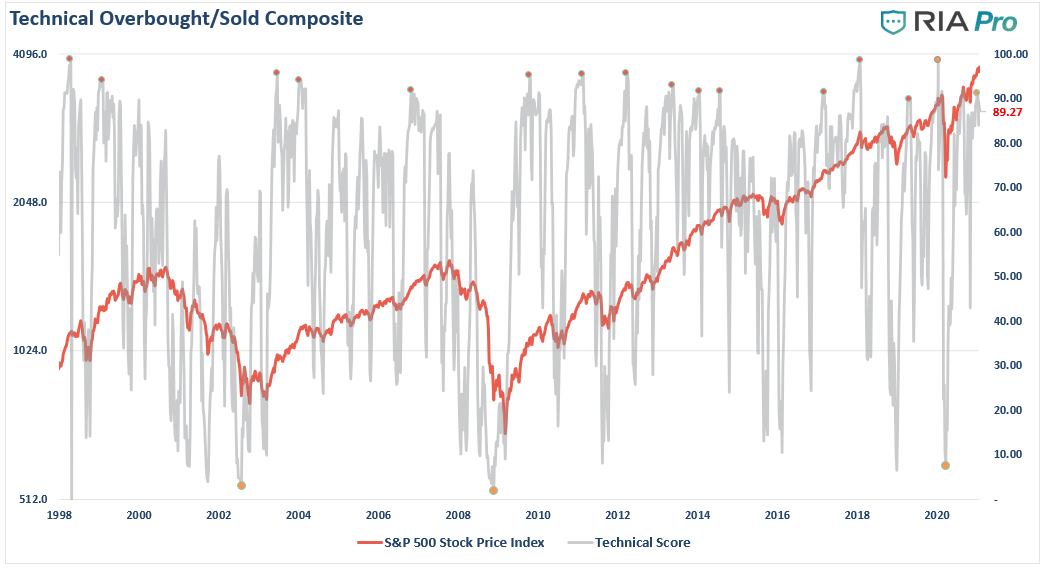
Technical Composite
The technical overbought/sold gauge comprises several price indicators (RSI, Williams %R, etc.), measured using “weekly” closing price data. Readings above “80” are considered overbought, and below “20” is oversold.
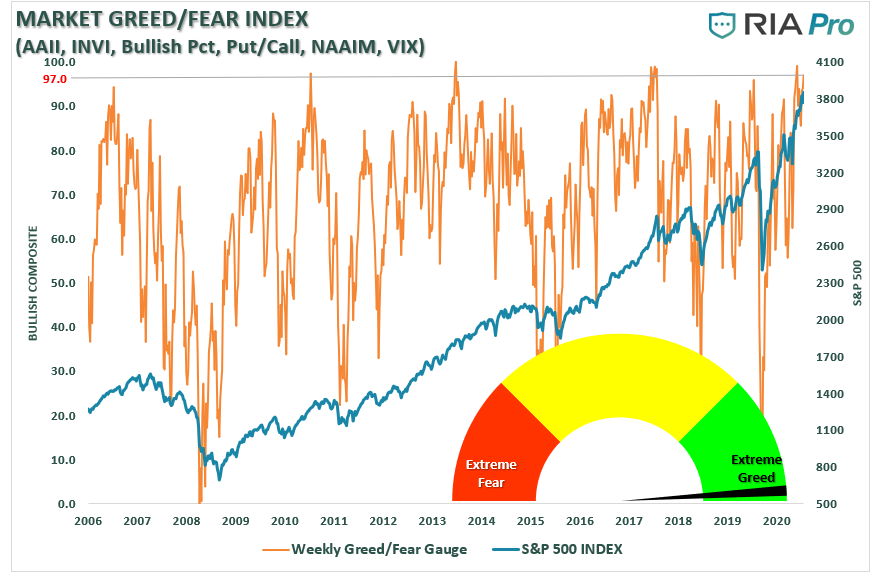
Portfolio Positioning “Fear / Greed” Gauge
The “Fear/Greed” gauge is how individual and professional investors are “positioning” themselves in the market based on their equity exposure. From a contrarian position, the higher the allocation to equities, to more likely the market is closer to a correction than not. The gauge uses weekly closing data.
NOTE: The Fear/Greed Index measures risk from 0-100. It is a rarity that it reaches levels above 90. The current reading is 97.0 out of a possible 100.
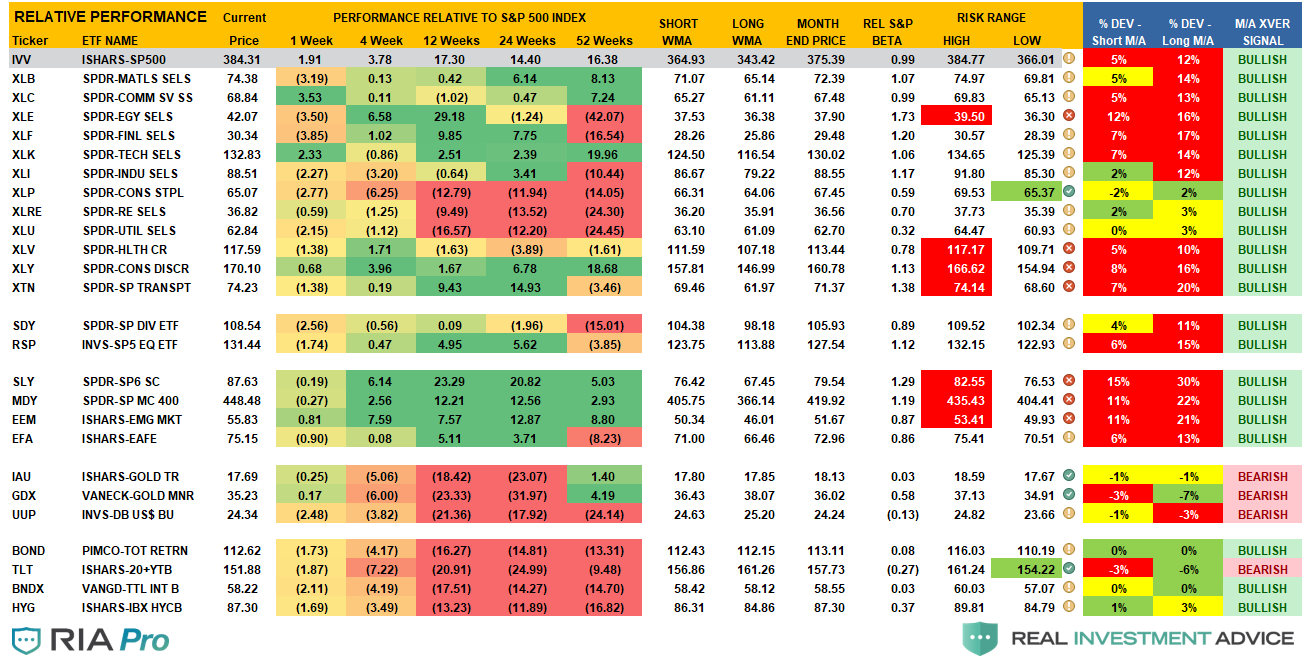
Sector Model Analysis & Risk Ranges
How To Read.
- The table compares each sector and market to the S&P 500 index on relative performance.
- The “MA XVER” is determined by whether the short-term weekly moving average crosses positively or negatively with the long-term weekly moving average.
- The risk range is a function of the month-end closing price and the “beta” of the sector or market.
- The table shows the price deviation above and below the weekly moving averages.
Weekly Stock Screens
Currently, there are 3-different stock screens for you to review. The first is S&P 500 based companies with a “Growth” focus, the second is a “Value” screen on the entire universe of stocks, and the last are stocks that are “Technically” strong and breaking above their respective 50-dma.
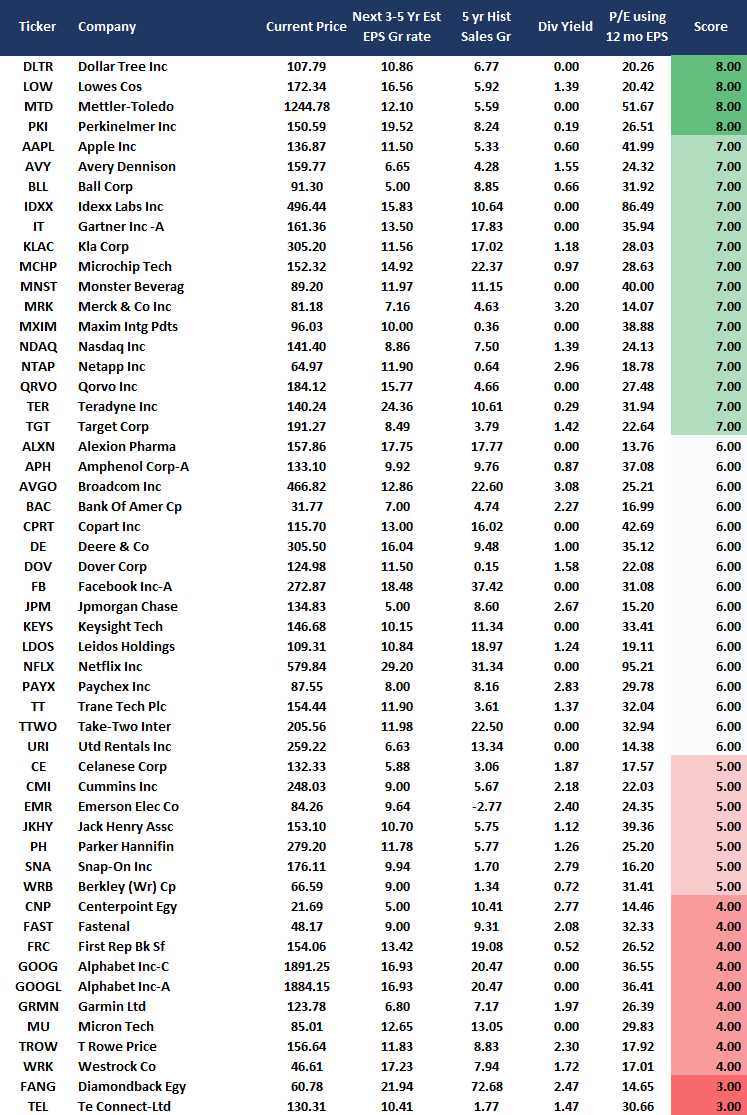
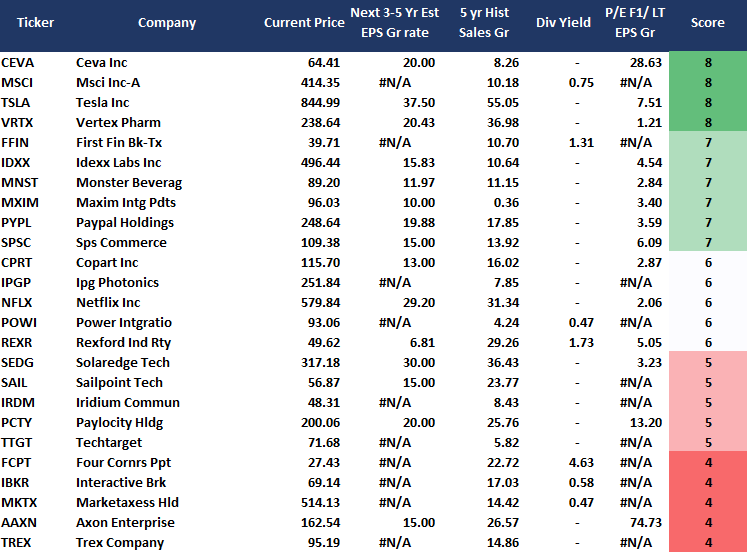
We have provided the yield of each security and a Piotroski Score ranking to help you find fundamentally strong companies on each screen. (For more on the Piotroski Score – read this report.)
S&P 500 Growth Screen
Low P/B, High-Value Score, High Dividend Screen

NEW! Fundamental Growth Screen

Aggressive Growth Strategy
Portfolio / Client Update
With the inauguration now behind us, the focus turns to corporate earnings. So far, with the first week of earnings behind us, everything is pretty much as expected. The question will be if the rest of the year can stand up to too optimistic forecasts.
As noted above, many of our indicators are starting to send off warning signs we could be close to a short-term correction. When those signals begin to trigger will sell our index position holdings of SPY and RSP, which will immediately increase cash by 15%.
We also started adding duration back into our bond portfolio this past week, which should also act as a hedge against any corrective event. As noted below, we adjusted our holdings to align with our benchmark more closely. Such should help increase performance this year while allowing our risk management strategies to curtail downside risk.
As always, if you have any questions, please don’t hesitate to reach out to your advisor.
Portfolio Changes
During the past week, we made minor changes to portfolios. We post all trades in real-time at RIAPRO.NET.
We are slowly making changes to the portfolio allocation model to move it closer to the benchmark weightings. Given we were underweight technology and discretionary, and overweight communications, we are modifying holdings to correct those imbalances.” – 01/19/21
- Sell 100% of CMCSA (Comcast) – Communications
- Buy 2% of portfolio value in LOW (Lowe’s) – Discretionary / Stop-loss is $160
- Add 1% of portfolio value to AAPL (Apple) increasing weight to 3% / Stop-loss is $120
- Also add 1% of portfolio value to MSFT (Microsoft) increasing weight to 3% / Stop-loss is $210
- And add 1.5% of portfolio value to AMZN (Amazon) increasing weight to 3% / Stop-loss is $3000
“We sold the entirety of our position in UNH this morning. While we like the company very much it really came down to the fact that we were overweight healthcare, relative to the equal weight S&P 500 benchmark, and needed to reduce our weighting slightly.” – 01/21/21
- Sell 100% of UNH (United Healthcare)
This morning’s sell-off has now triggered our money flow indicator requiring us to take our two index trading positions off of the table. We are also selling CVX in response to Biden’s executive order to ban drilling on Federal lands and in offshore waters. We are holding our other drillers which should benefit from the eventually reduced supply caused by this order resulting in higher oil prices.” – 01/22/21
- Sell 100% RSP, SPY
- Sell 100% CVX
We are aware of the risks and are carrying tight stops on all positions.
As always, our short-term concern remains the protection of your portfolio. We have now shifted our focus from the election back to the economic recovery and where we go from here.
Lance Roberts
CIO
THE REAL 401k PLAN MANAGER
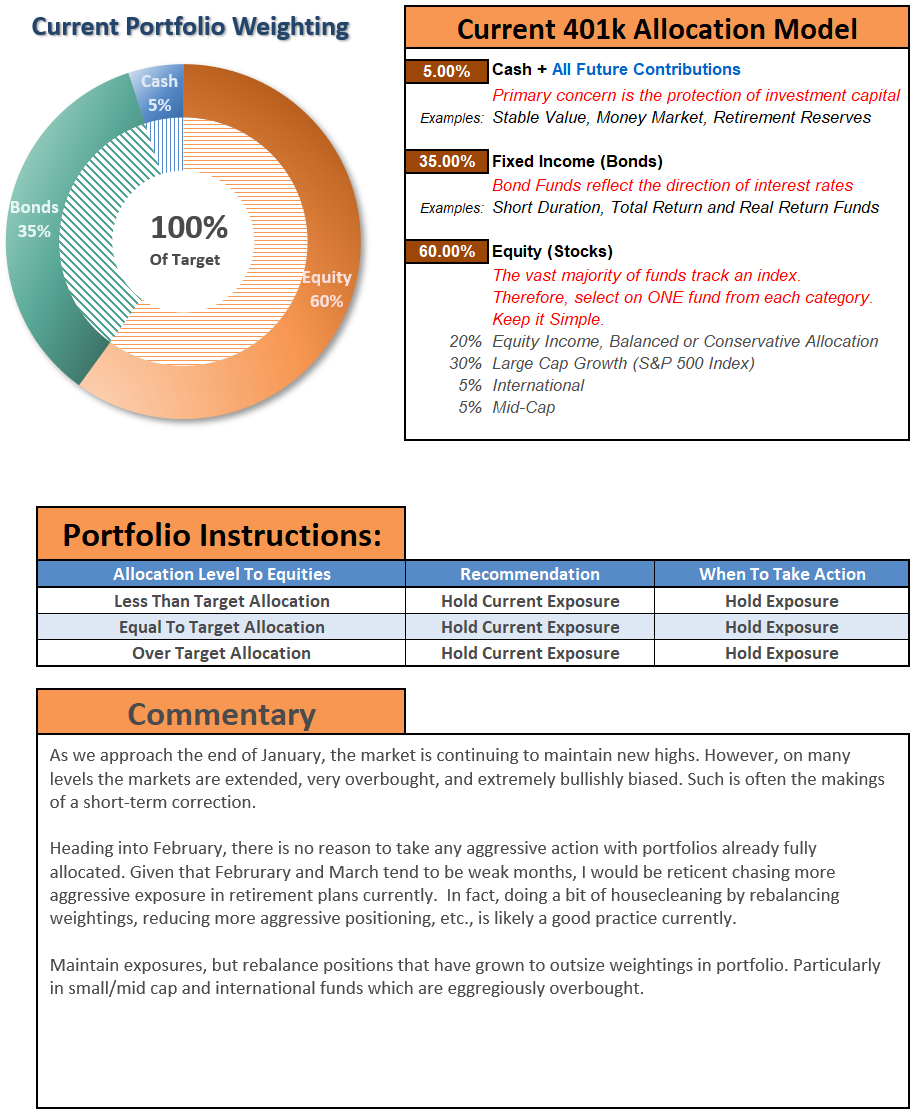
A Conservative Strategy For Long-Term Investors
If you need help after reading the alert, do not hesitate to contact me.

Model performance is a two-asset model of stocks and bonds relative to the weighting changes made each week in the newsletter. Such is strictly for informational and educational purposes only, and one should not rely on it for any reason. Past performance is not a guarantee of future results. Use at your own risk and peril.

401k Plan Manager Live Model
As anRIA PRO subscriber (You get your first 30-days free), you can access our live 401k plan manager.
Compare your current 401k allocation to our recommendation for your company-specific plan and our 401k model allocation.
You can also track performance, estimate future values based on your savings and expected returns, and dig down into your sector and market allocations.
If you would like to offer our service to your employees at a deeply discounted corporate rate, please contact me.


Lance Roberts is a Chief Portfolio Strategist/Economist for RIA Advisors. He is also the host of “The Lance Roberts Podcast” and Chief Editor of the “Real Investment Advice” website and author of “Real Investment Daily” blog and “Real Investment Report“. Follow Lance on Facebook, Twitter, Linked-In and YouTube
Customer Relationship Summary (Form CRS)
Also Read


