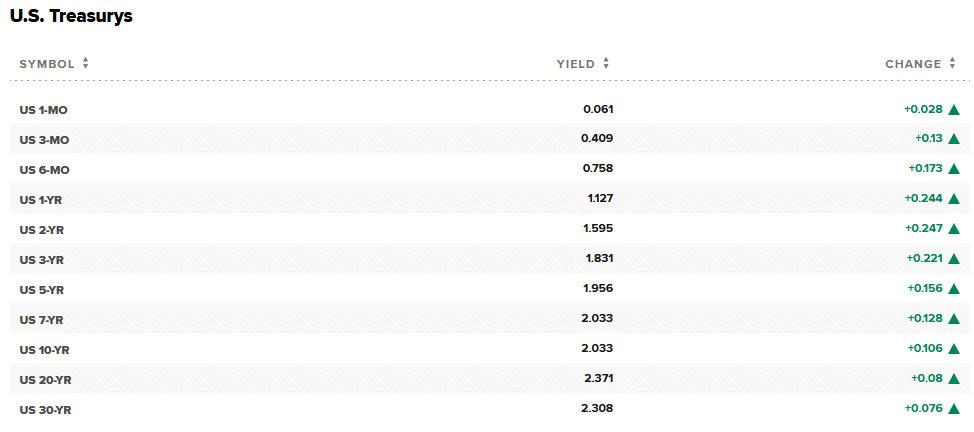
Bond investors panicked yesterday on higher than expected inflation. The most noticeable yield changes occurred in the shorter maturities as shown below. To wit, the yield on two-year notes rose 25 basis points. As if the CPI inflation report wasn’t enough to scare bond investors, St. Louis Fed President Bullard is now talking about hiking Fed Funds in 50bps increments and starting QT by summer. Most notable in yesterday’s bond market action is how investors are flattening the yield curve. Stock investors appear to be waking up to the bond market’s message.

What To Watch Today
Economy
- 10:00 a.m. ET: University of Michigan Sentiment, February preliminary (67.0 expected, 67.2 in January)
Earnings
- 6:55 a.m. ET: Under Armour (UAA) to report adjusted earnings of 7 cents on revenue of $1.47 billion
- 7:00 a.m. ET: Apollo Global (APO) to report adjusted earnings of $1.10 on revenue of $1.16 billion
- 7:30 a.m. ET: Dominion Energy (D) to report adjusted earnings of 91 cents on revenue of $4.04 billion
- 8:00 a.m. ET: Goodyear Tire (GT) to report adjusted earnings of 32 cents on revenue of $4.96 billion
Market Fails At Resistance
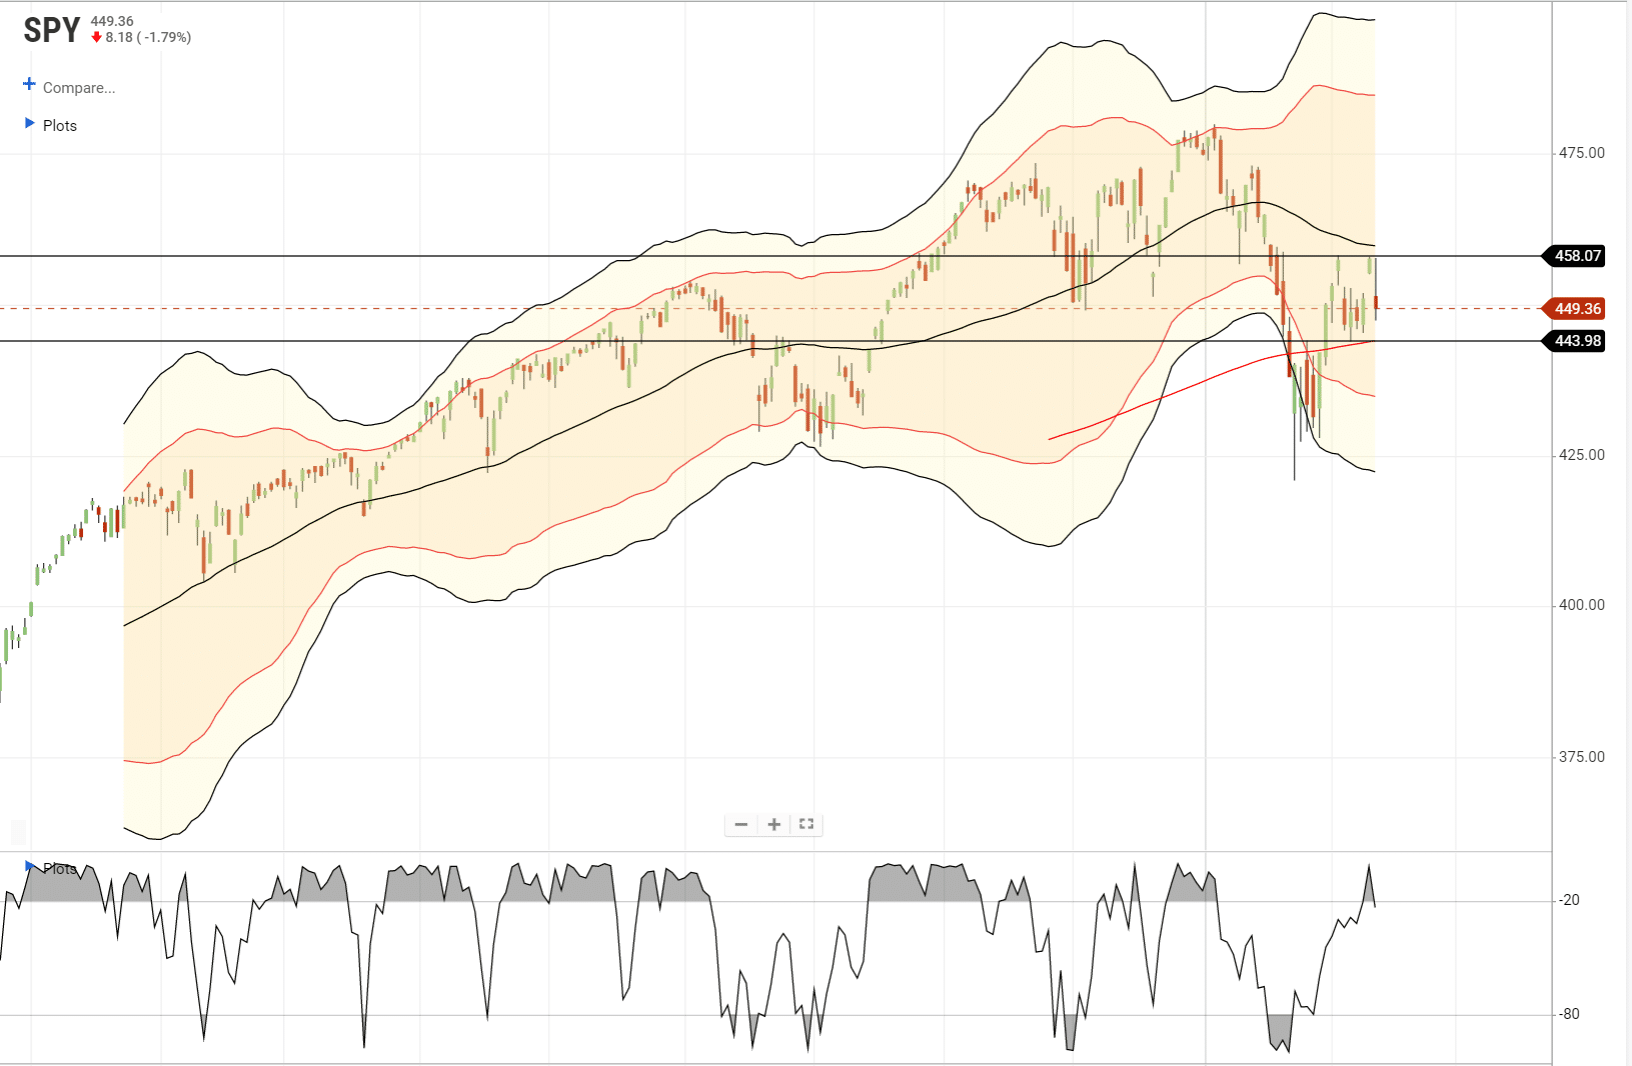
Both bond investors and stock investors took it on the chin yesterday following the CPI report and comments from James Bullard about a more aggressive interest rate policy. However, despite the sell-off, the market is only back to where it was on Monday.
We currently remain trapped between the 50- and 200-dma. A break below the 200-dma will set up a retest of the January lows. If it holds and turns up, we will continue to establish a more positive trend from January. For now, we remain trapped in “no-mans” land.
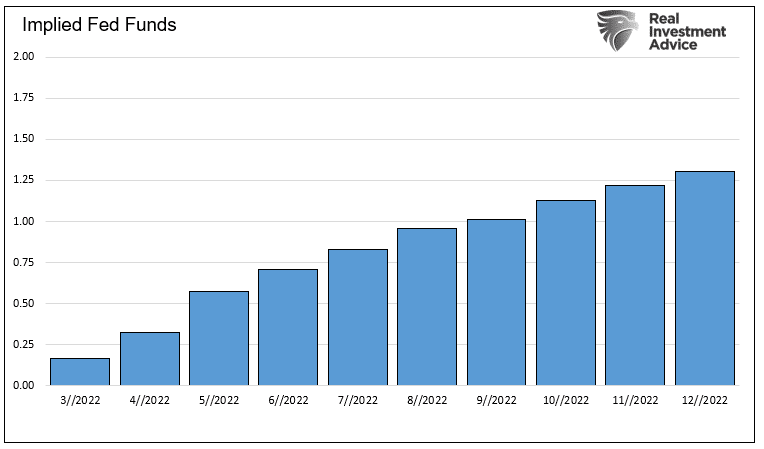
Bullard Offsets Bostic
Yesterday’s Commentary noted Atlanta Fed President Raphael Bostic’s relatively dovish forecast for three or four rate hikes this year. St. Louis President James Bullard seems to have a different opinion. He stated- “I’d like to see 100 basis points in the bag by July 1.” He added that he would like to start reducing the balance sheet in the second quarter. There are three meetings between now and July. Bullard, therefore, implies the Fed will raise rates by 50bps in at least one of the three meetings. He would also like to start QT at one of those meetings. The graph below shows Fed Funds futures imply about 80 bps of Fed tightening by July, with a total of 1.25% by year-end.
Inflation & Rate Tweets
Had a thread on inflation and rates this morning.
Red Hot Inflation
The January CPI inflation report came in hotter than expected, and CPI is now at the highest annual level since 1982. The year-over-year rate increased to 7.5% from 7.0% and above expectations for 7.3%. More importantly, the monthly rate was up 0.6%, the same as last month, and 0.1% above expectations. The 0.6% monthly rate implies inflation is still running at an annualized rate greater than 7%. Recent Fed speakers have mentioned that the trend is important in assessing monetary policy. With today’s data, it’s hard to make the case that the inflation trend is easing.
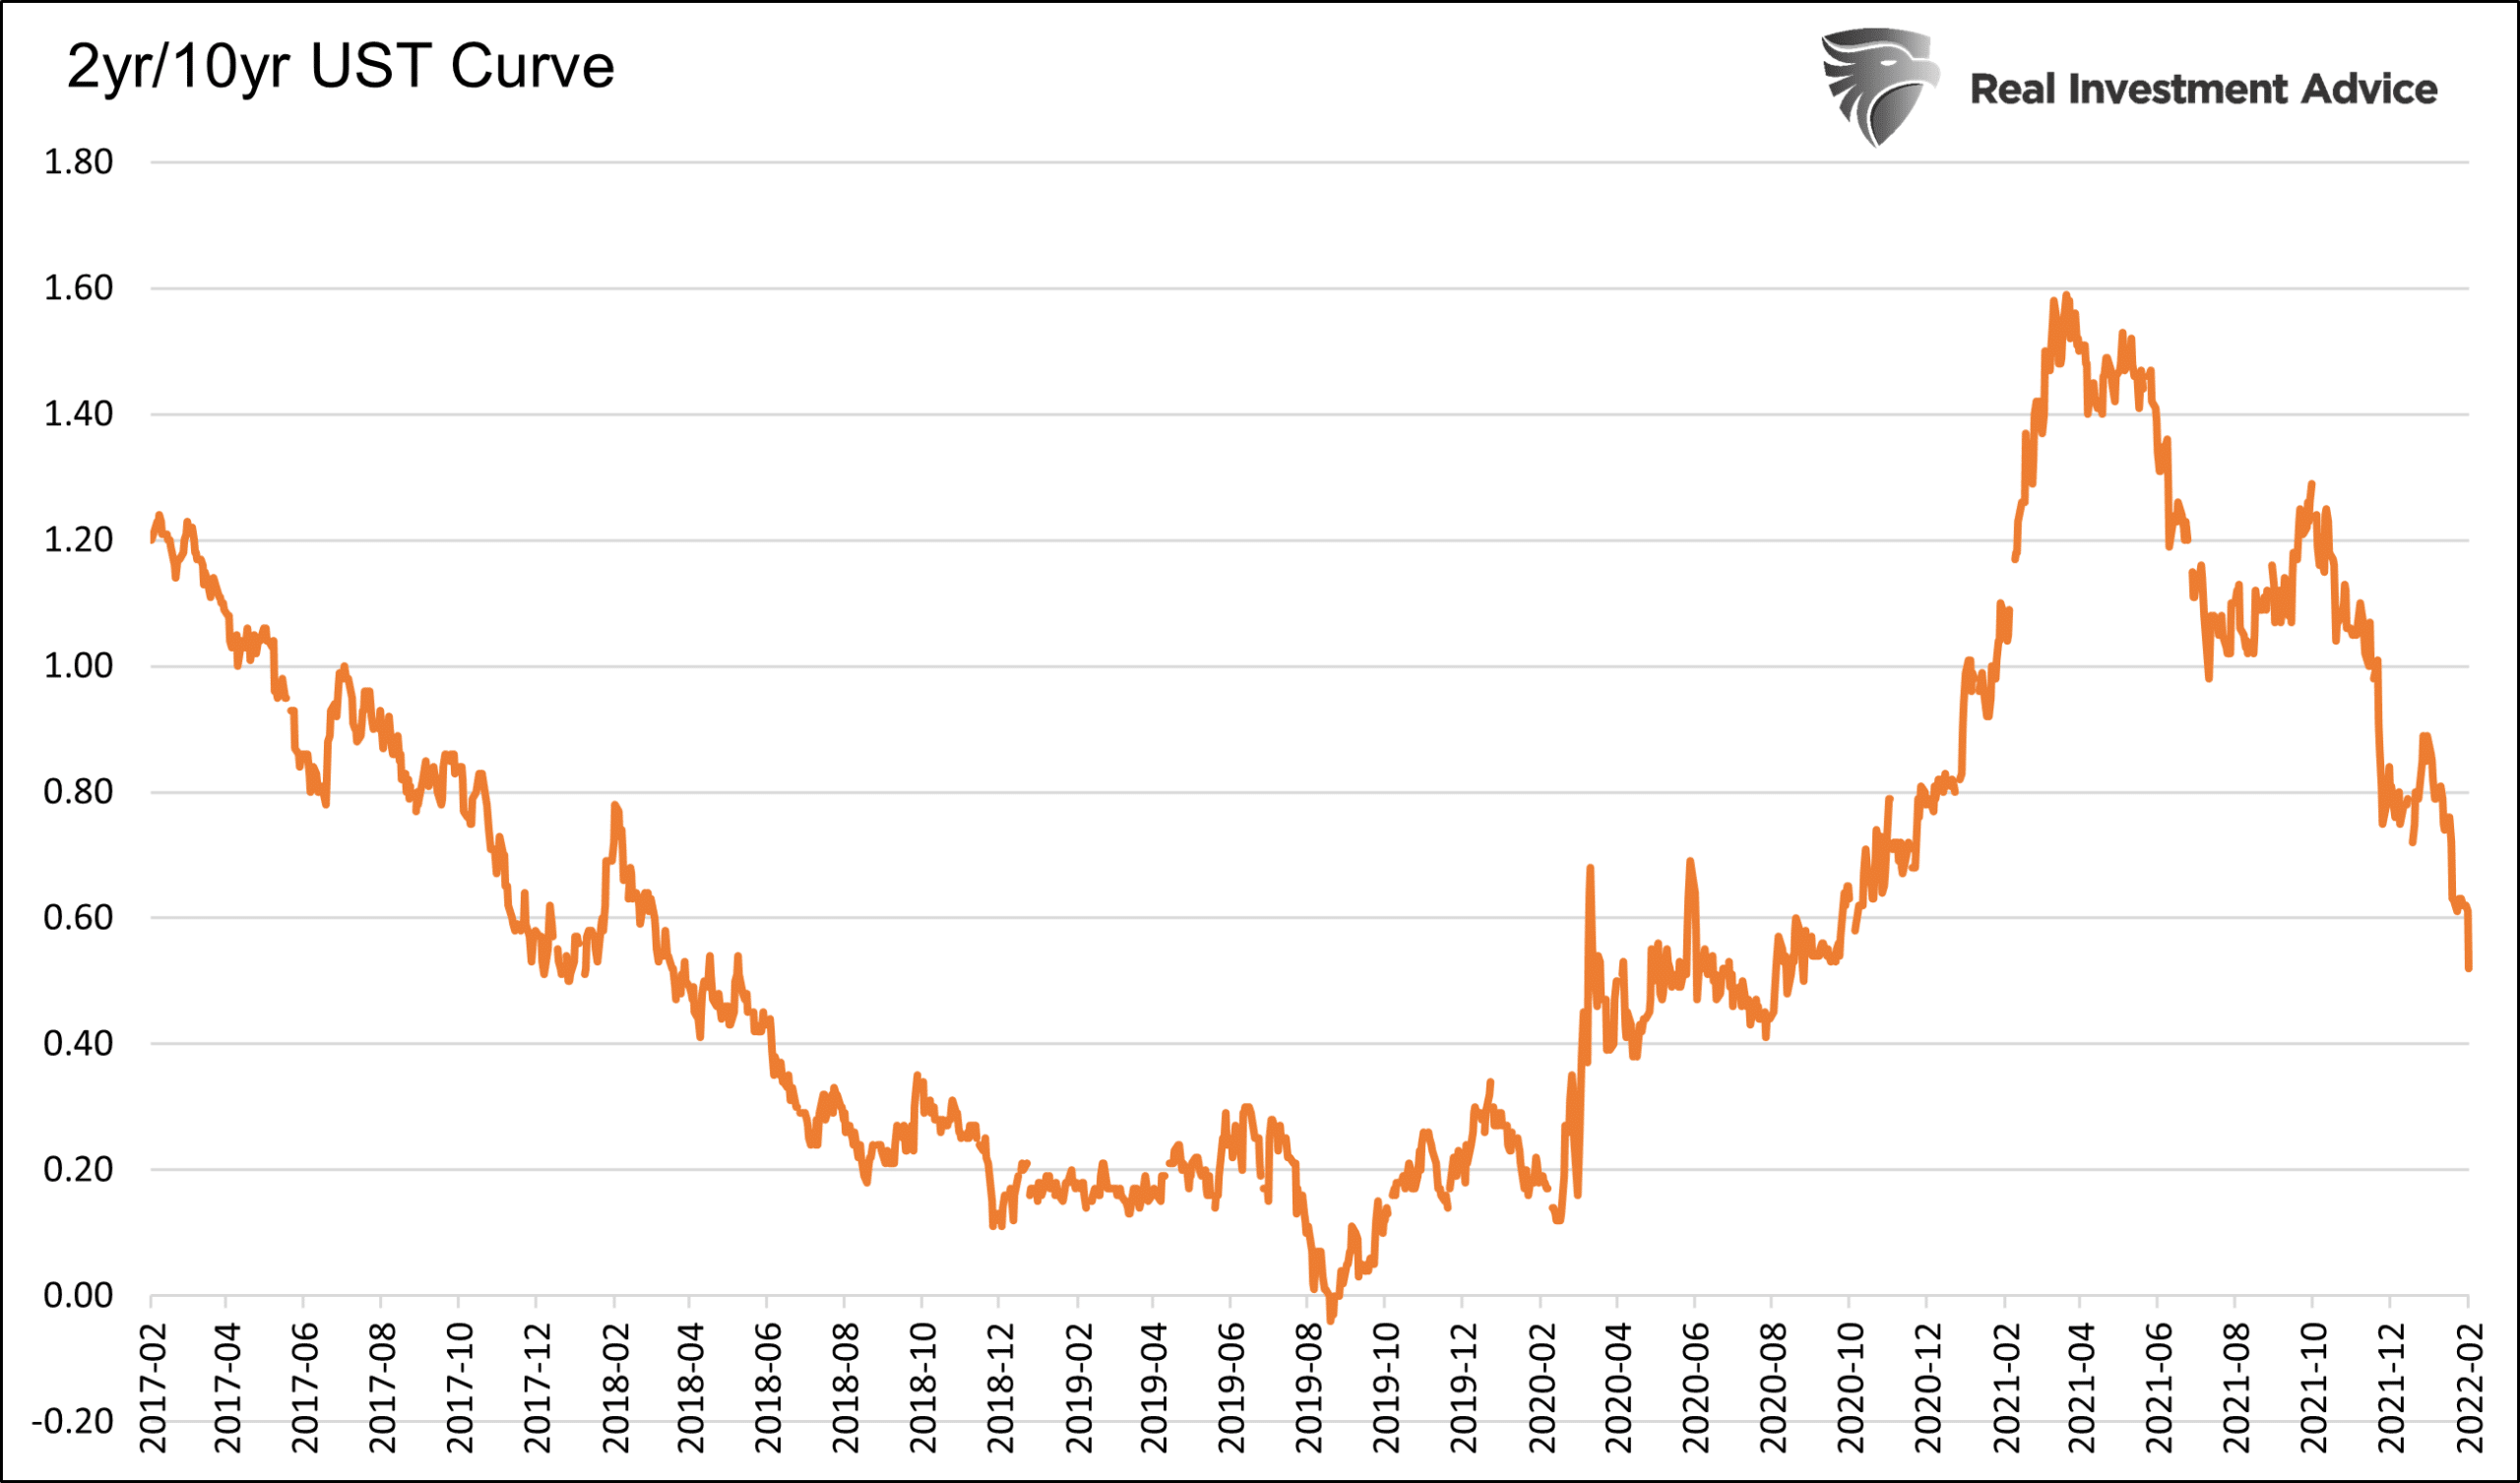
After the CPI report, Fed Funds futures contracts expiring in late 2022, fell by about 20-25 basis points, implying the market is pricing in an additional 25bps increase by year-end. Further, it also implies a 50bps rate increase at the March 16th meeting. The yield curve continues to flatten, with the 2s/10s curve declining by another 15 basis points, as shown below. The quickly flattening curve tells us the market is aggressively pricing in rate hikes. Longer maturity bond yields are rising but at a much slower clip. Investors assume that higher Fed Funds will truncate future growth and hamper inflation. For what its worth, the last time inflation was at current levels, Fed Funds were at 11.50%
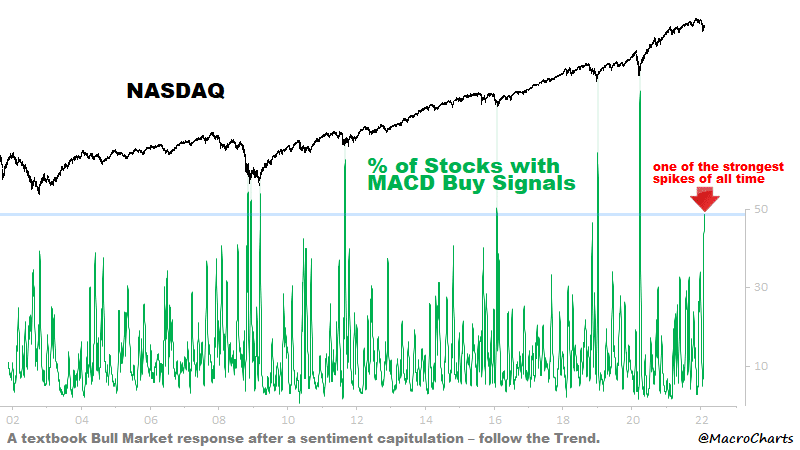
Don’t Give Up On The Bull Market
The graph below, courtesy of @macrocharts, shows every time in the last 20 years that over 50% of NASDAQ stocks registered a MACD buy signal, the NASDAQ bottomed. The NASDAQ is currently at such levels once again after the recent decline. While the gauge has held up well, it’s worth noting that in 2008/09, 50% of stocks flashed buy signals in October and November of 2008, only to reach a lower low. The NASDAQ finally reached its cycle bottom in March 2009 and registered a third buy signal that was the true bottom.
Please subscribe to the daily commentary to receive these updates every morning before the opening bell.
Also Read