


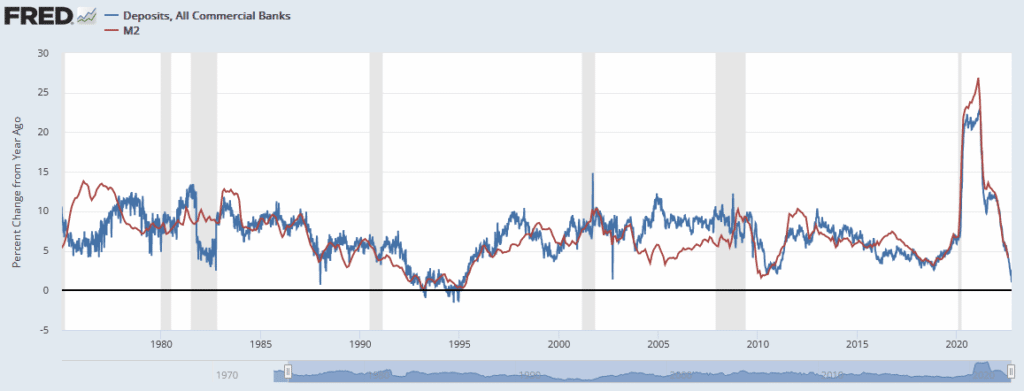
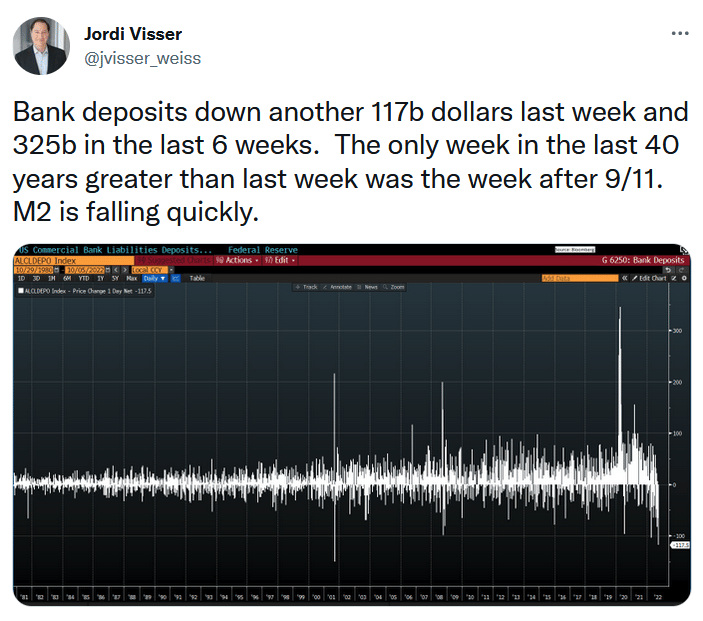
You may be thinking, why should I care about bank deposits? There are a couple of reasons, but first, consider that all money is lent into existence. The lending process and, therefore, money creation begins with bank deposits. As bank deposits shrink, as they recently have been, less money is created. As shown below, money supply growth is shrinking quickly and in line with bank deposits. This bodes well for inflation. The interplay between the money supply and monetary velocity, or how often money circulates, drives inflation. With bank deposits and the money supply growth shrinking, inflation should decline. If the economy weakens further and velocity slows, inflation could fall rapidly. We provide more information on monetary velocity below.
While the disinflationary scenario we lay out above is good, the problem is that money is liquidity. As the amount of money and debt decline, economic activity and financial markets will likely struggle. The Fed, via higher rates and QT, is trying to manage bank deposits, the money supply, and ultimately the economy to achieve a soft landing, whereby inflation falls at a minimal economic cost. Can they land the plane on a very narrow runway?

What To Watch Today
Economy
- 7:00 a.m. ET: MBA Mortgage Applications, week ended Oct. 14 (-2.0% prior)
- 8:30 a.m. ET: Housing Starts, September (1.462 million expected, 1.575 prior)
- 8:30 a.m. ET: Building Permits, September (1.530 million expected, 1.517 million prior)
- 8:30 a.m. ET: Housing Starts, month-over-month, September (-7.1% expected, -12.2% prior)
- 8:30 a.m. ET: Building Permits, month-over-month, September (-0.8% expected, -10.0% prior)
- 2:00 a.m. ET: U.S. Federal Reserve Releases Beige Book
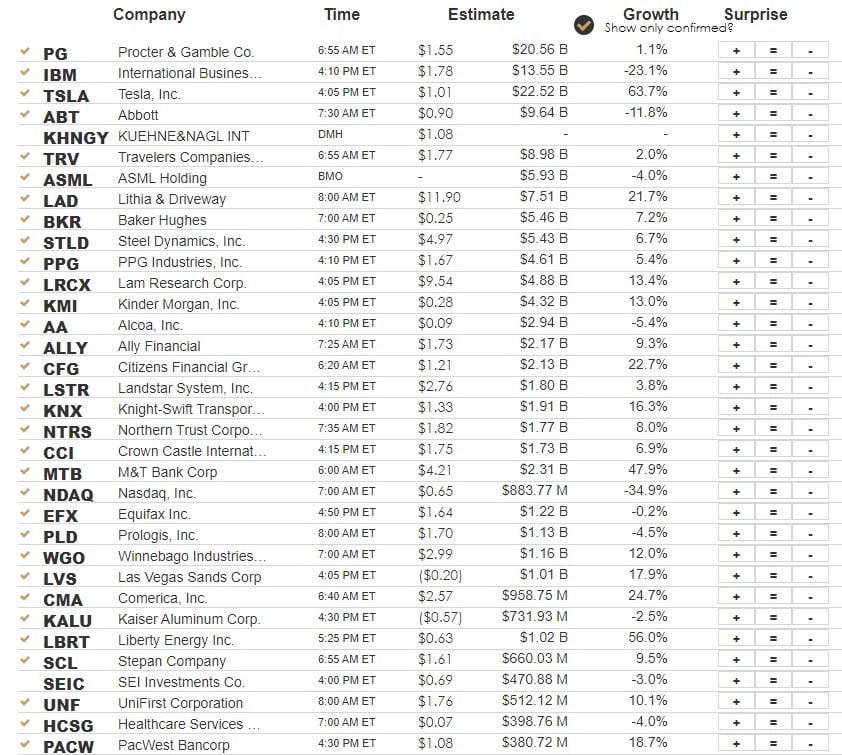
Earnings
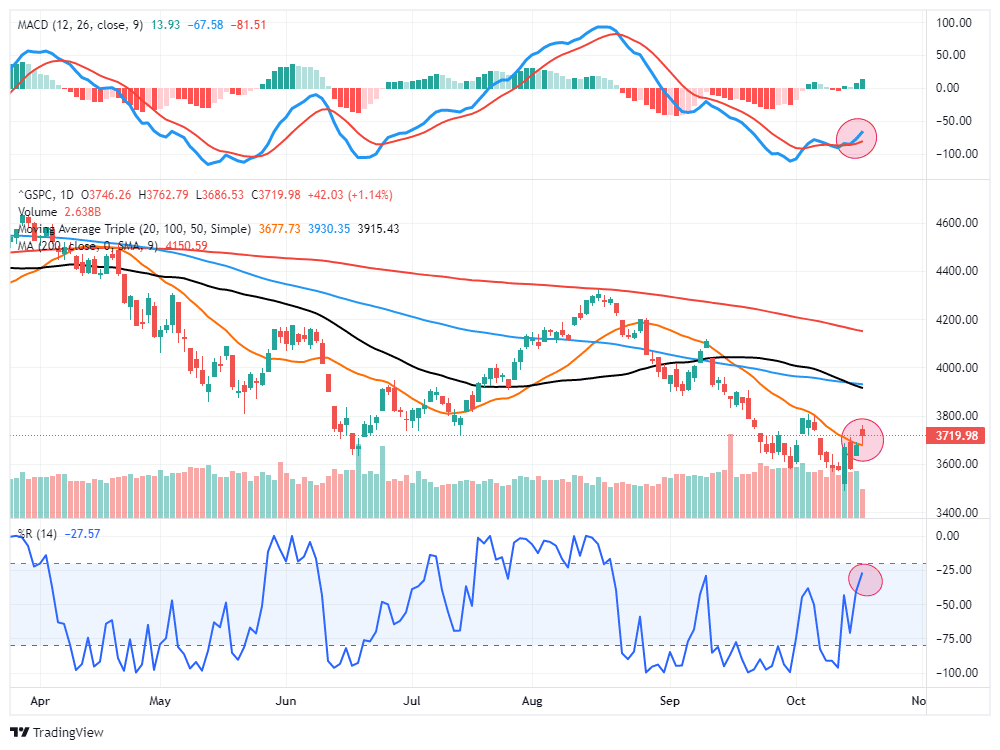
Market Trading Update
Yesterday, the market mustered another rally breaking above the 20-dma. That move opens up an advance to the 50- and 100-dma resistance, currently clustered at 3900. Notably, the MACD and the Williams %R indicators showed a positive divergence from the recent decline and still have upside room currently. Such suggests we could see some follow-through over the next couple of weeks. As discussed, the corporate stock buyback window opens on the 28th, and earnings will likely be NOT as “bad as expected,” which should give investors some confidence. We still suggest fading the rally, but we can give it some room near term, which is why we added some additional equity exposure over the last few days.
Defining Monetary Velocity
Given that monetary velocity is equally important as the money supply, it is worth a quick discussion of what velocity is and how its trends.
Velocity is nominal GDP divided by the monetary base (Q/M). Velocity measures people’s willingness to hold cash or how often cash turns over. Lower velocity means that people hoard cash, which usually happens during periods of economic weakness and credit stress. In contrast, as we see today, higher velocity tends to result when people avoid holding cash. Inflation is a good reason to spend cash today instead of watching its purchasing power decline over time. The Fed directly controls the money supply but only influences velocity.
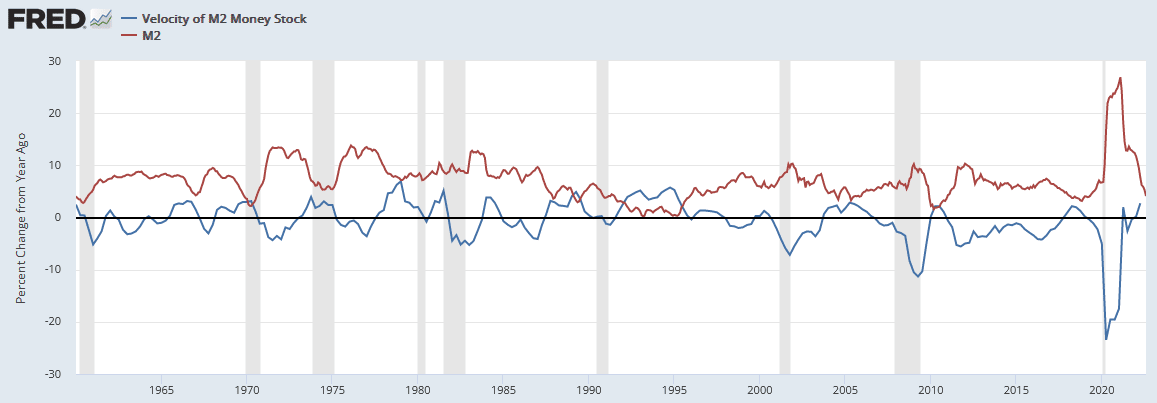
The graph below shows that money supply (M2) and velocity often offset each other. Such keeps inflation tame. However, velocity can pick up more than the money supply falls and feed inflation. This was the case during the last two instances of high inflation (the mid-70s and the late 70s -early 80s). While everyone stares at bank deposits and money supply for inflation clues, we urge you also to track velocity. We will have more on the relationship between money supply and velocity in an upcoming article.
Is Financial Stability an Issue?
In Lance’s latest article, Fed Rate Hikes Approaching the Breaking Point, he discusses the risk the Fed is taking with each rate hike. To wit:
History is clear that the Fed’s current actions are once again behind the curve. Each rate hike puts the Fed closer to the unwanted “event horizon.”
When the lag effect of monetary policy collides with accelerating economic weakness, the Fed will realize its mistake.
That risk is much greater than the Fed currently realizes.
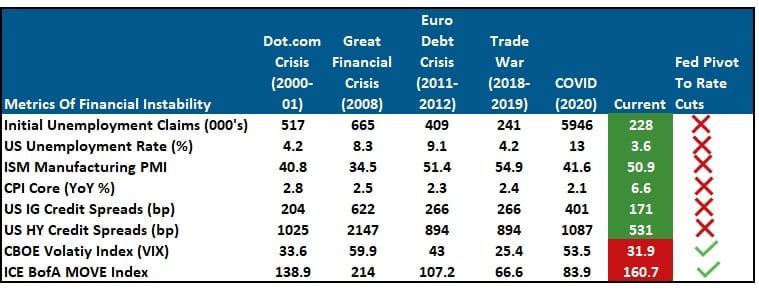
The table below shows why the Fed is not currently concerned about the “breaking point.” The table contains economic, inflation, and financial stability measures. Except for volatility in the stock and bond markets, all other indicators signal a strong economy, high inflation, and no financial stress as judged by credit spreads. The problem with the table is the lag effect of rising interest rates. The rate hikes from last spring are just starting to affect the economy and markets. The Fed continues to hike rates aggressively, unsure how and when the prior rate hikes will hit the economy and markets. Currently, the Fed’s visibility is greatly limited as the data in the table below may change quickly. The best way to describe the dangers the Fed faces is to equate it with driving very fast in the fog.
Tweet of the Day
Please subscribe to the daily commentary to receive these updates every morning before the opening bell.
If you found this blog useful, please send it to someone else, share it on social media, or contact us to set up a meeting.
Also Read


