


There is a 6.4 million discrepancy between the change in employment level and the change in unemployment level.
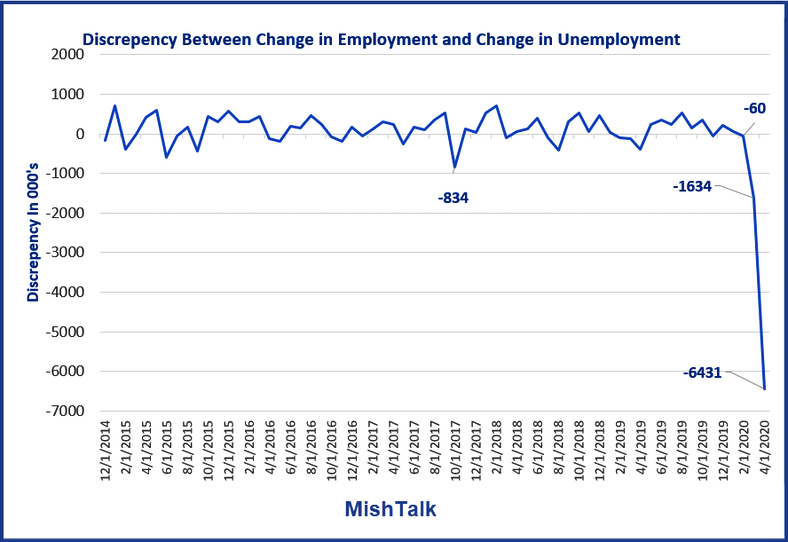
Such is a new all time record discrepancy between employment and unemployment in the Household Survey that measures the unemployment rate.

Household Survey April 2020

I created the lead chart as follows:
Discrepancy = Change in Employment Level – (-1 * Change in Unemployment Level)
Confirmation
- The number of employed fell by 22.369 million.
- Those unemployed only rose by 15.938 million.
- Employment discrepancy is 22.369 – 15.938 = 6.431 million
Negligible Labor Force Discrepancy
- Change in Labor Force: -6.431 Million
- Change in Not in Labor Force: +6.570 Million
- The labor force discrepancy is 6.570 – 6.431 = 0.139 million
Discrepancy Comparison
- Employment Discrepancy Percentage: 28.8%
- Labor Force Discrepancy Percentage: 2.1%
Unemployment Rate Formula
Unemployment Rate = (Unemployed / Labor Force) * 100
Therefore, the unemployment Rate = (23.078 / 156.481) * 100 = 14.7%
That is how the BLS calculated the unemployment rate.
Factoring in the Employment Discrepancy
Unemployment Rate = ((23.078 + 6.431) / 156.481) * 100 = 18.6%

BLS Bogus Unemployment Rate Number
The BLS is very aware they published a bogus number.
Here is the pertinent BLS statement.
If the workers who were recorded as employed but absent from work due to “other reasons” (over and above the number absent for other reasons in a typical April) had been classified as unemployed on temporary layoff, the overall unemployment rate would have been almost 5 percentage points higher than reported (on a not seasonally adjusted basis).
However, according to usual practice, the data from the household survey are accepted as recorded. To maintain data integrity, no ad hoc actions are taken to reclassify survey responses.
Data Integrity
To maintain “data integrity” the BLS reported a number known to be bogus.
And it does not stop there either.
Fiddling With Seasonal Adjustments
During their review of household survey data for April, BLS staff tested for outliers to determine whether any changes were needed to the seasonal adjustment models. BLS staff determined that the vast majority of household survey data series had significant outliers in April and manually added outlier terms to the seasonal adjustment models.
Somehow, fiddling with massive outliers, and making manual adjustments to remove them, does not violate “data integrity”.
And it still does not stop there.

BLS Birth-Death Model
The Birth-Death Model pertains to estimates the BLS makes in regards to the birth or death of businesses not persons.
The BLS assumes that in a normal economy X number of businesses will be created. The BLS then adds Y number of employees to its employment count as a result.
This controversial procedure is widely panned, but I stopped commenting on it in January of 2014, because the overall impact is normally tiny.
Even some prominent economists do not understand the BLS process. It’s complicated, so I will leave it at that, except to say that when people comment on the adjustment, the comments are typically wildly off the mark, not the adjustment itself.
However, at economic turning points, the Birth-Death model itself is way off base.
Fiddling With the BLS Birth-Death Model
The BLS issued unusual statements this month regarding the Birth Death Model.
The establishment survey estimates use a model to account for the relatively stable net employment change generated by business births and deaths. Due to the impact of the COVID-19 pandemic, the relationship between the two was no longer stable in April. Therefore, the establishment survey made changes to the birth-death model.
BLS Synopsis
- The BLS started with a baseline measure of unemployment known to be bogus by approximately 5 percentage points.
- Then they also applied heavily modified changes to the Birth-Death model and applied those changes to the Establishment Survey job number.
- They the apply heavily modified seasonal adjustments to both Establishment Survey Jobs Number and the Household Survey Unemployment Numbers..
I have had discussions with the BLS about this process in the past. Specifically I have have asked for Seasonally-Adjusted Birth-Death numbers and was informed they do not produce such numbers and it does not fit their methodology.
Normally, I believe the birth-death model has minor impacts. In April, we have major changes of highly uncertain amounts.
This process makes the jobs numbers itself (-20.5 million), not just the unemployment rate, highly suspect.
Three-Point Summation
- It is necessary to knowingly publish a ridiculous estimate of a the unemployment rate, a key economic number, in order to maintain data integrity.
- To maintain integrity of the reported number of jobs and the reported unemployment rate, we bury the discrepancies in footnotes that few see and even fewer comment on.
- But hey, the stock market liked the fact we beat the street.
Additional Details
For further discussion of the Birth-Death model and other BLS statements for April, please see my discussion of the Jobs report: Over 20 Million Jobs Lost As Unemployment Rises Most In History.

Mike Shedlock,/ Mish is a registered investment advisor and a though leader on economics and finance. His “MishTalk” global economics blog is highly read and he posts several articles daily on the global economy. Topics include interest rates, central bank policy, gold, precious metals, jobs, and economic reports from an Austrian Economic perspective. Follow Mish on Twitter or email him.
Also Read


