


Investors mistakenly believe their financial partners are students of holistic financial planning. Outside of sell-side biased market information pumped out daily by an employer’s research department, there are several areas of study that many brokers would prefer to avoid.
Worse are the practitioners who confidently communicate erroneous Medicare and Social Security advice which results in consumers leaving thousands of lifetime income dollars on the table. Then, there are the brokers who utilize comprehensive financial planning as a tool to sell products with little focus on sequence of returns risk or lower future asset class returns that may drain a retiree’s investment nest egg faster than anticipated.
There are 5 areas of concern investors must consider (even though brokers will discount their importance). I decided to break the actions into 5 separate blog posts so readers are not overwhelmed.
1). Inflation must be adjusted and matched to specific goals.
Inflation is personal to and differs for every household.
My household’s inflation rate will differ from yours.
Thanks to an inflation project undertaken by the Federal Reserve Bank of Atlanta, there’s now a method to calculate a personal inflation rate. A smart idea is to compare the results of their analysis to the inflation factor your financial professional employs in retirement and financial planning. Instruct your adviser to complete an additional planning scenario which incorporates your personalized consumer price index and see how it affects your end results or outcomes.
The bank has undertaken a massive project to break down and study the elements of inflation along with the creation of a myCPI tool which captures the uniqueness of goods that individuals purchase.
Researchers estimate average expenditures using a calculation which incorporates various cross-demographic information including sex, age, income, education and housing status. The result is 144 different market baskets that may reflect a closer approximation to household’s personal cost of living vs. the average consumer. It’s easy to use and sign up for updates.
My personal CPI peaked in July 2008 at an annualized rate of 5.2%. Currently, it’s closer to 1.7%. For living expense planning purposes, I use the average over the last decade which comes in at 2.1%.
The tool can help users become less emotional and gain rational perspective about inflation. Inflation tends to be a touchy subject as prices for everything must always go higher (which isn’t the case). I’ve witnessed how as a collective, we experience brain drain when we rationalize how inflation impacts our financial well-being. It’s a challenge to think in real (adjusted for inflation) vs. nominal terms.
I hear investors lament about the “good old days,” often where rates on certificates of deposit paid handsomely. For example, in 1989, the year I started in financial services, a one-year CD yield averaged 7.95%. Inflation at the time was 5.39%. After taxes, investors barely earned anything, but boy, those good old days were really somethin’ weren’t they?
We’re all inflation experts because we live with it daily. It’s an insidious financial shadow. It follows us everywhere. We just lose perspective at times as the shadow ebbs and flows, shrinks and expands depending on our spending behavior. Interestingly, as humans, we tend to anchor to times when inflation hit us the hardest.

I’m not saying inflation isn’t important. The dilemma is that a majority of brokers will blindly adhere to default inflation rates provided in their respective financial planning software. If inaccurate inflation rates are employed, or not personalized for a household’s goals, they have the potential to under or overestimate spending needs, especially throughout retirement.
As an investor, I want you to be prepared to consider inflation in a logical manner (perhaps teach your financial partner a thing or two).
Here are 3 concepts to remember.
2). Specific financial goals may require varied rates of inflation.
A financial plan is a voluminous snapshot of wealth building in process. A plan (hopefully, along with a knowledgeable financial partner), helps forecast how specific actions can lead to success (or failure) to meet future goals. However, the effectiveness of a plan is only as good as the inputs employed to create it.
The adage of “garbage in, garbage out,” not only goes for the accuracy of personal financial information shared to prepare the plan, it also applies to the asset-class returns and inflation estimates employed. Financial planning software is user-ready with built-in assumptions about returns and inflation estimates; it’s the responsibility of your advisor or brokerage firm to review defaults and decide if or when they require change. For example, one of several programs we utilize at RIA defaults to the Consumer Price Index (CPI) for its base inflation rate. A series of default projected asset class returns are also provided.
As a group, we annually review these inputs and update if warranted. Early in 2018, we decided to reduce forecasted returns on every asset class due to stretched fundamentals, excluding international and emerging markets. Although our investment committee finds international stocks attractive from a valuation perspective, we maintain zero broad exposure to them. I’m getting ahead of myself as I expand on valuations in the second blog post of the series.
As a reminder, the Consumer Price Index is the average change over time in prices paid for a market basket of consumer goods and services. There are two target populations or groups the Bureau of Labor Statistics calculates for its main series: All Urban Consumers (the “CPI-U” population), and Urban Wage Earners and Clerical Workers (the “CPI-W” population).
From the BLS:
The CPI-U population covers about 88 percent of the U.S. population or households in all areas of the United States except people living in rural nonmetropolitan areas, in farm households, on military installations, in religious communities, and in institutions such as prisons and mental hospitals.
The CPI-W is a subset of CPI-U and covers the CPI-U population households for whom 50 percent or more of household income comes from wages and clerical workers’ earnings. The CPI-W’s share of the total U.S. population has diminished over the years; the CPI-W population is now about 28 percent of the total U.S. population. The CPI-W population excludes households of professional and salaried workers, part-time workers, the self-employed, and the unemployed, along with households with no one in the labor force, such as those of retirees.
Listen, it’s the best we have when it comes to broad measures of inflation. Thus, the historical inflation rate used in most financial planning programs are not incorrect per say, it’s just designed to capture spending of the mass population, not your household where spending may differ. It’s acceptable to be utilized in plans but when it comes to specific future spending goals especially in retirement, perhaps we can do better.
3). Gain a grip on your household’s PIR or Personal Inflation Rates.
So, how do you create PIR or Personal Inflation Rates? Initially, seek to partner with a fiduciary or Certified Financial Planner® to create and prioritize financial goals segmented into needs and wants. Needs are the financial milestones which are most important and may include college funding requirements, retirement income needs and healthcare and long-term care insurance costs. Wants and wishes as secondary, tertiary desires such as overseas trips or the convertible foreign sportscar you always wanted should also be in a plan!
For each goal, it should be determined whether current CPI (or CPI-U) over the last 12 months should be employed or a rate which differs higher or lower than CPI. I would also spend a few minutes and discover your household’s rate of inflation through the Federal Reserve Bank of Atlanta’s myCPI tool. Complete the brief questionnaire and collect data for 12 months (you’ll receive regular e-mail updates from the Reserve Bank), before consideration as replacement for the broad-based CPI in your plan. I recommend waiting a year as I’ve witnessed the rate change dramatically, so it’s best to gain an understanding of the trend in your personal rate.
Specific goals such as college funding, long-term care coverage, and additional healthcare-related expenditures above what Medicare-related insurance will cover, consistently trend at twice or greater the broad-based CPI. Planning software must be adjusted accordingly.
For example, at RIA we monitor trends in healthcare and long-term care inflation through the Kaiser Family Foundation research at www.kff.org, www.medicarerights.org, and www.genworth.com, respectively. We monitor overall trends including inflation that is “sticky,” or consistently rising, through the Federal Reserve Bank Of Atlanta’s ongoing inflation project at www.frbatlanta.org.

4). Keep an open mind: Inflation can change throughout retirement.
I love westerns, especially “The Big Valley.” Rich story lines and robust acting by Barbara Stanwyck as the matriarch of the Barkleys, along with Lee Majors and Richard Long as members of a California ranching family, have captivated me for years.
Your spending in retirement is mostly a big valley. I’ll explain:
Several of the Certified Financial Planners at RIA partner with clients who have been in retirement-income distribution mode for over a decade. In other words, these clients are re-creating paychecks through systematic portfolio withdrawals and Social Security/pension retirement benefits. Although we formally plan for an annual cost-of-living increase in withdrawals, rarely if at all does this group contact us every year to increase their distributions!
There’s a time series in retirement where active-year activities, big adventures conclude, and retirees enter the big valley of level consumption. I call it the “been there done that,” stage where a retiree has moved on; the overseas trips have been fulfilled and enrichment thrives a bit closer to home.
Retirees move from grandiose bucket list spending to a long period or valley of even-toned, creative, mindful endeavors. It’s a sweet spot, an extended time of good health; so, healthcare is not so much an inflationary or heavy spending concern. The big valley stage is just a deeper, relaxed groove of a retirement lifetime.
A thorough analysis I refer to often because it reflects the reality I witness through clients, was conducted by David Blanchett, CFA, CFP® and Head of Retirement Research for Morningstar. The research paper, “Estimating the True Cost of Retirement,” is 25 pages and should be mandatory reading for pre-retirees and those already in retirement (along with financial professionals).
David concludes:
“While research on retirement spending commonly assumes consumption increases annually by inflation (implying a real change of 0%), we do not witness this relationship within our dataset. We note that there appears to be a “retirement spending smile” whereby the expenditures actually decrease in real terms for retirees throughout retirement and then increase toward the end. Overall, however, the real change in annual spending through retirement is clearly negative.”
David eloquently defines spending as the “retirement spending smile.” As a fan of westerns, I envision the period as a valley bracketed by the spending peaks of great adventures on one side, healthcare expenditures on the other. Hey, I live in Texas. This analogy works better for me.
In comprehensive financial planning, it’s prudent to be conservative and incorporate an inflation rate to annual spending needs.
Medical costs affect retirees differently. Unfortunately, it’s tough as we age to avoid healthcare costs and the onerous inflation attached to them. Thankfully, proper Medicare planning is a measurable financial plan expense as a majority of a retiree’s healthcare costs will be covered by Medicare along with Medigap or supplemental coverage.
Unfortunately, many retirees are ill-prepared for long-term care expenditures which are erroneously believed to be covered by Medicare. Generally, long-term care is assistance with activities of daily living like eating and bathing. At RIA, we use an annual inflation factor of 4.5% for additional medical expenses (depending on current health of the client), and the cost of long-term care.
David suggests an alternative inflation proxy for older workers. The Experimental Consumer Price Index for Americans 62 Years of Age and Older or the CPI-E, reflects contrast of category weightings when compared to CPI-U or CPI-W, the CPI for urban consumers and urban wage earners, respectively.
Unfortunately, don’t expect CPI-E to gain traction as it would result in robust COLA or cost-of-living adjustments to Social Security benefits. Intuitively, it makes sense that greater relative importance is placed on medical care for seniors. However, based on the burden of social programs on the federal budget, don’t expect CPI-E to be employed anytime in the foreseeable future.
Table 2. Comparative analysis of CPI relative importance data of selected expenditure groups, December 1995.
Expenditure Group CPI-U CPI-W CPI-E
All items 100.00 100.00 100.00
Food and beverages 17.33 19.26 15.00
Food at home 9.88 11.21 9.66
Food away from home 5.89 6.37 4.23
Alcoholic beverages 1.57 1.68 1.10
Housing 41.35 38.89 46.89
Shelter 28.29 25.98 33.88
Apparel and upkeep 5.52 5.53 3.93
Transportation 16.95 19.02 13.82
Medical care 7.36 6.26 12.14
Medical care commodities 1.28 1.06 2.57
Medical care services 6.08 5.21 9.57
Health Insurance .36 .25 1.09
Entertainment 4.37 4.03 3.35
Other goods and services 7.12 7.01 4.87
College tuition 1.61 1.19 0.59
Inflation is indeed the omnipotent boogeyman in the room and must be addressed.
Due to globalization, technological advancement, increased competition and decreased domestic energy dependence, inflation overall has progressively trended lower for decades (thankfully).
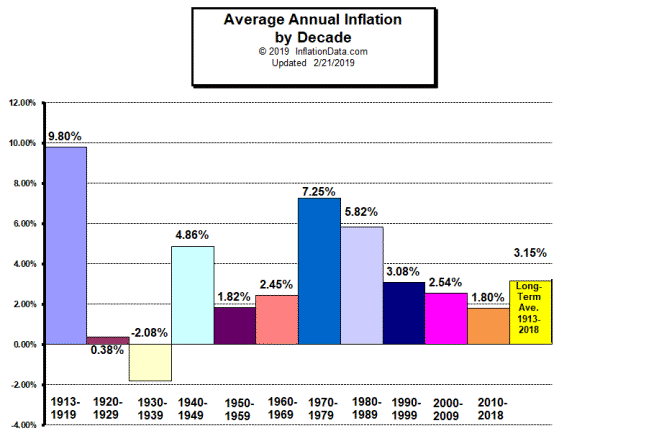
Chart courtesy of www.inflationdata.com.
A responsibility of your advisor (among many), is to study current macro/micro trends in inflation and update your plan accordingly to determine how these trends may impair or complement future financial aspirations.
Next up in the blog series:
2). The “Valuations Matter,” pre-retirement portfolio adjustment.


Richard Rosso, MS, CFP, CIMA is the Head of Financial Planning for RIA Advisors. He is also a contributing editor to the “Real Investment Advice” website and published author of “Random Thoughts Of A Money Muse.” Follow Richard on Twitter
Customer Relationship Summary (Form CRS)
Also Read


