Economic Cycle Set To Improve But Are Bulls Too Bullish?


Inside This Week’s Bull Bear Report
- Market Review & Update
- Economic Cycle Set To Improve
- How We Are Trading It
- Research Report – Market Cycles And Why The Bull Isn’t Dead
- Youtube – Before The Bell
- Market Statistics
- Stock Screens
- Portfolio Trades This Week
Market Review & Update
Earnings season is underway, and so far, corporate outlooks remain relatively upbeat, suggesting the economic cycle might improve. While it is too early to tell for sure, as we will discuss in more detail today, some evidence may support that view and the potential for the market to eclipse all-time highs by next year.
As we discussed in Thursday’s Daily Market Commentary (subscribe for daily email):
“New all-time highs are coming. Given the fundamental and economic backdrop, I know that seems hardly logical, but that is what the technicals now suggest. The market has decisively cleared its 78.6% retracement of last year’s decline. Historically, when that occurs, new highs are a likely outcome. The combined momentum of the market, rising bullish sentiment, and the need to chase performance by managers are contributing to the seemingly unstoppable rally from the October lows.”
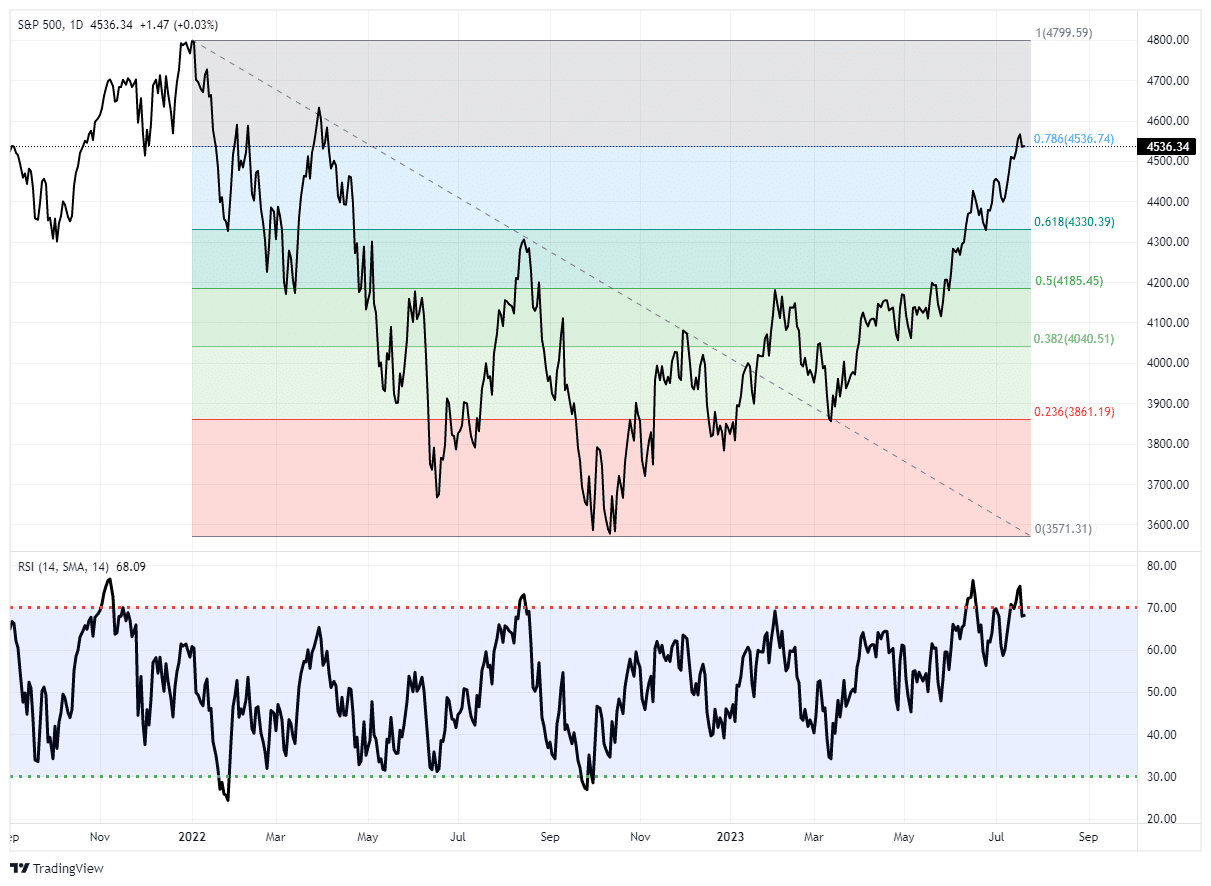
However, we must remember that market advances can only go so far before an eventual correction occurs. My best guess is that if the markets are to reach all-time highs this year, we will likely have a correction to reset some of the more extreme overbought conditions, as shown below.
With only minor resistance between here and the previous high. Any pullback to the 50-DMA is likely a good entry point to increase exposure on a better risk/reward basis.
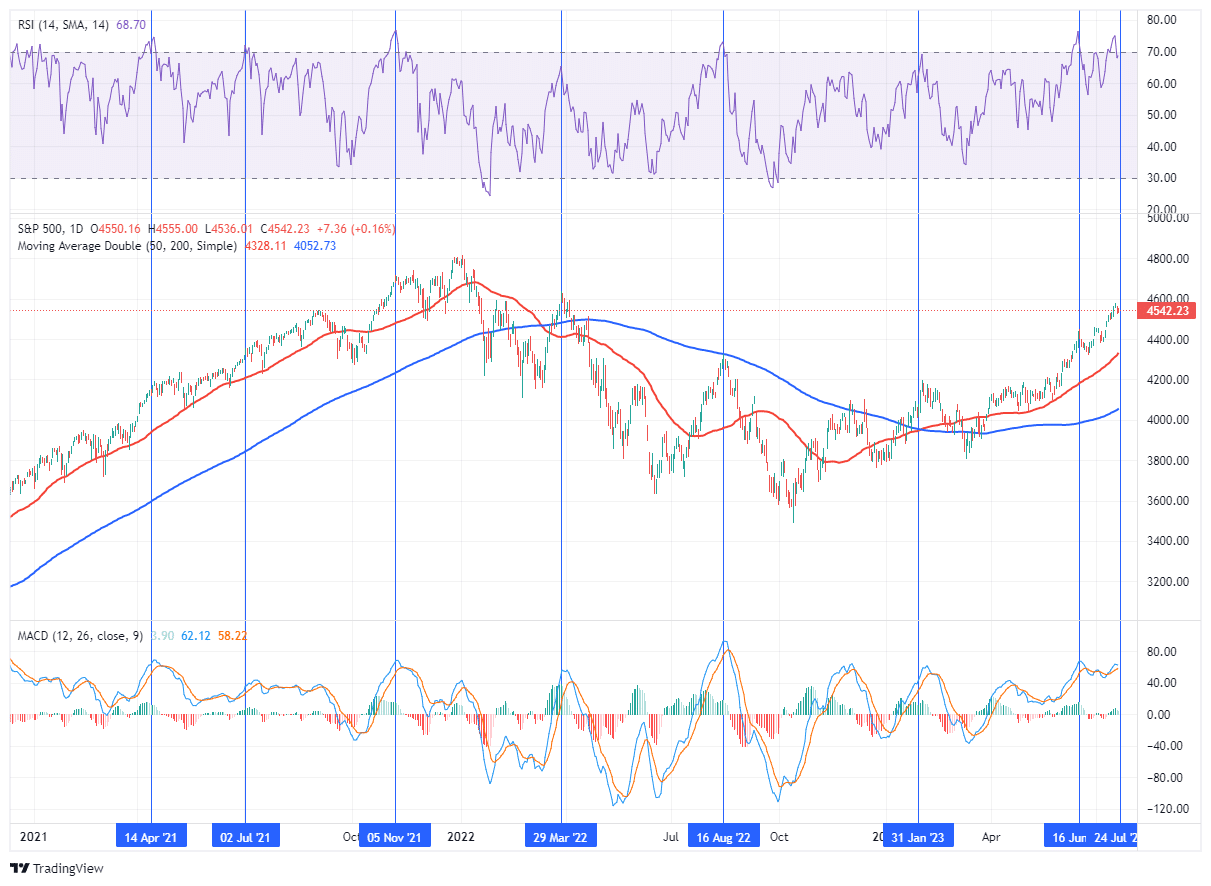
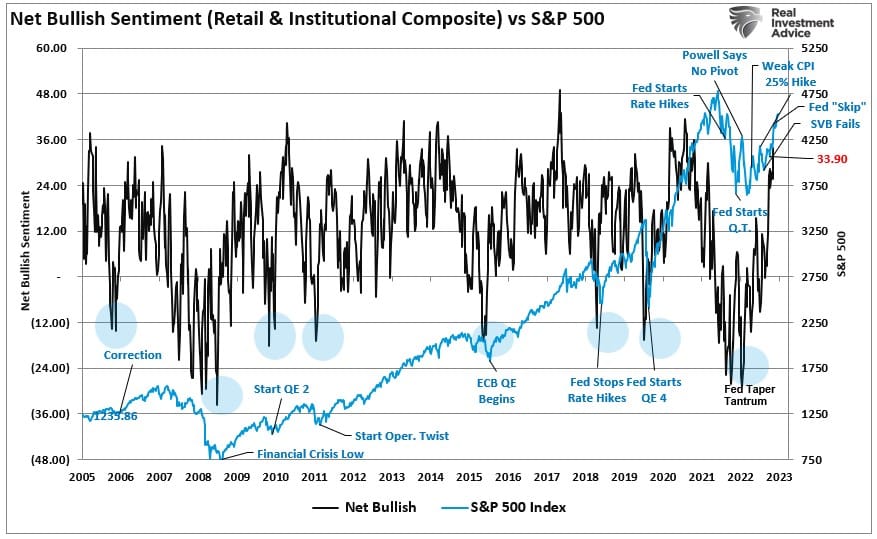
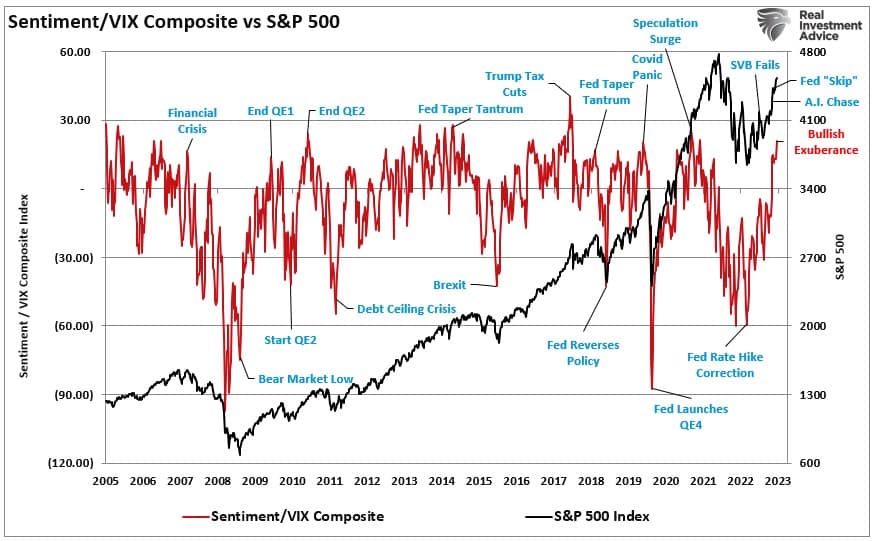
Furthermore, the sentiment of both retail and professional investors is getting rather extreme, along with the drop in volatility, which also suggests a correction is likely. Both charts below show that these indicators often align with short-term market peaks.
We continue to suggest remaining patient and opportunistically increasing equity exposure as needed. While it may “feel” like you are missing the boat currently, the market will always give you another opportunity to get on board.
This is especially true if Ed Yardeni is correct and we are heading to new all-time highs.
Need Help With Your Investing Strategy?
Are you looking for complete financial, insurance, and estate planning? Need a risk-managed portfolio management strategy to grow and protect your savings? Whatever your needs are, we are here to help.

There Is A Rhythm To Everything
There is a rhythm to the markets and the economy. For investors, the market and economic cycle lows support bull market recoveries. Just recently, Ed Yardeni made a bold prediction that the S&P 500 index could hit a high of 5400 in 2024. To wit:
“Market veteran Ed Yardeni predicts that the S&P 500 could reach a record high of 5,400 within the next 18 months. Yardeni, the head of Yardeni Research, believes that the current bull market, which began on October 12, 2022, will continue until at least the end of 2024. He expects the equity benchmark to make significant gains, with a target range representing an increase of 6.5% to 19.9% from its current level.”
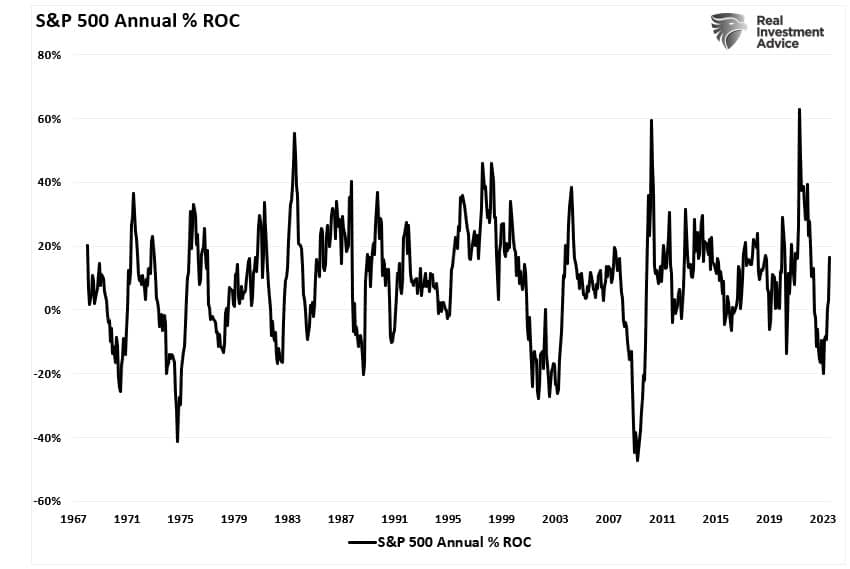
While that may seem outlandish given the economic and fundamental backdrop, the market cycle supports this claim. The chart below is the annual rate of change for the S&P 500 index. Unsurprisingly, the cycles are pretty obvious, and the recent trough of the market cycle in October is evident. That trough allows the current market cycle to continue higher near term.
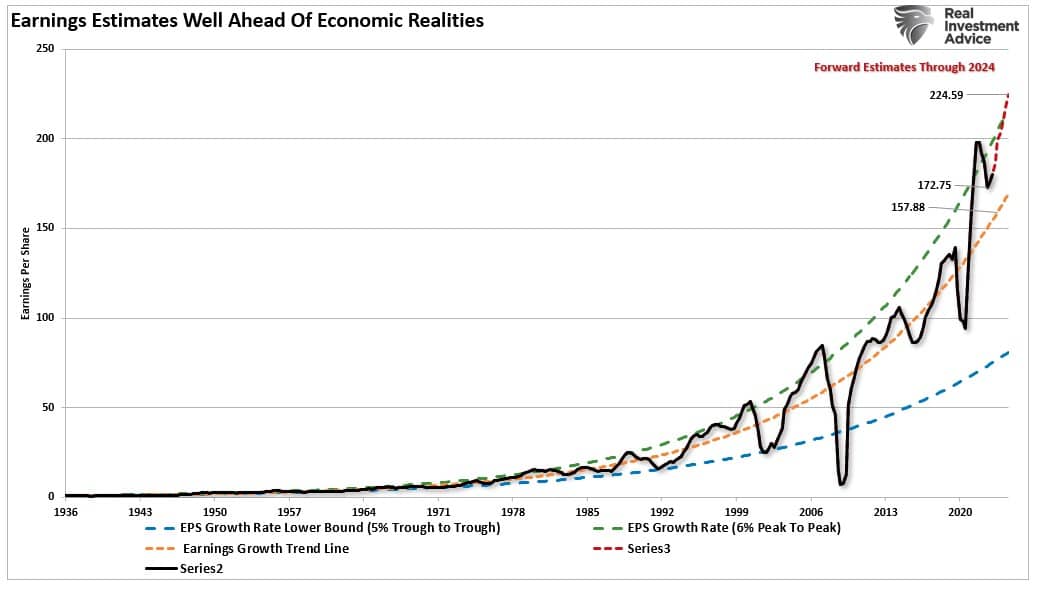
Unsurprisingly, earnings, which ultimately are reflected by the market’s price, are cyclical along with economic strength and weakness. We see the correlation when we overlay the annual rate of earnings change over the graph above. Such suggests that market participants are betting that the earnings cycle troughed in the first quarter of 2022 and will improve into 2024. This supports Yardeni’s claim of higher asset prices over the next 12-18 months.
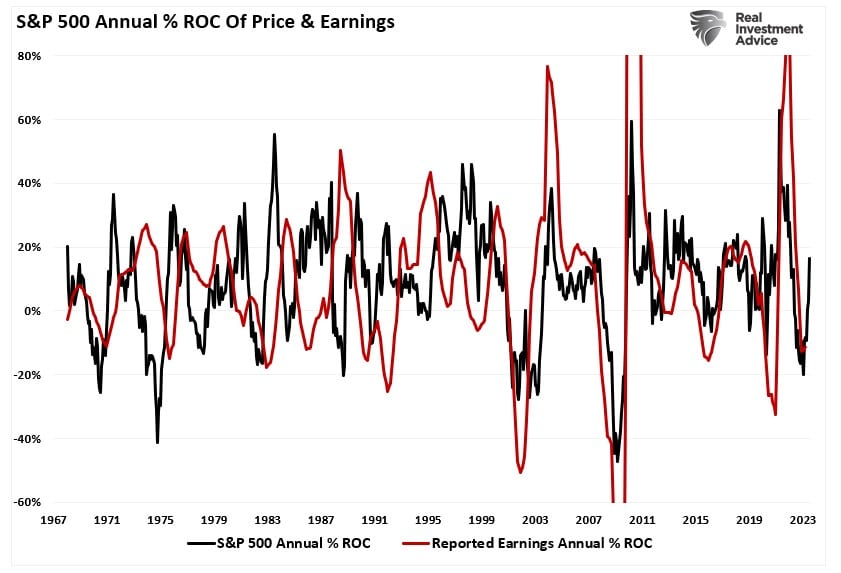
However, for earnings to improve, given earnings are derived from consumer activity, the economic cycle must begin to increase.
Economic Cycles Look Likely To Start Recovering
As with market cycles, the economy cycles as well. There is little argument the current economic data is fragile whether you look at the Leading Economic Index (LEI) or the Institute Of Supply Management (ISM) measures. As with the market cycle, long periods of slowing economic activity will eventually bottom and turn higher. The Economic Composite Index, comprised of 100 hard and soft economic data points, clearly shows the economic cycles. I have overlaid the composite index with the 6-month rate of change of the LEI index, which has a very high correlation to economic expansions and contractions.
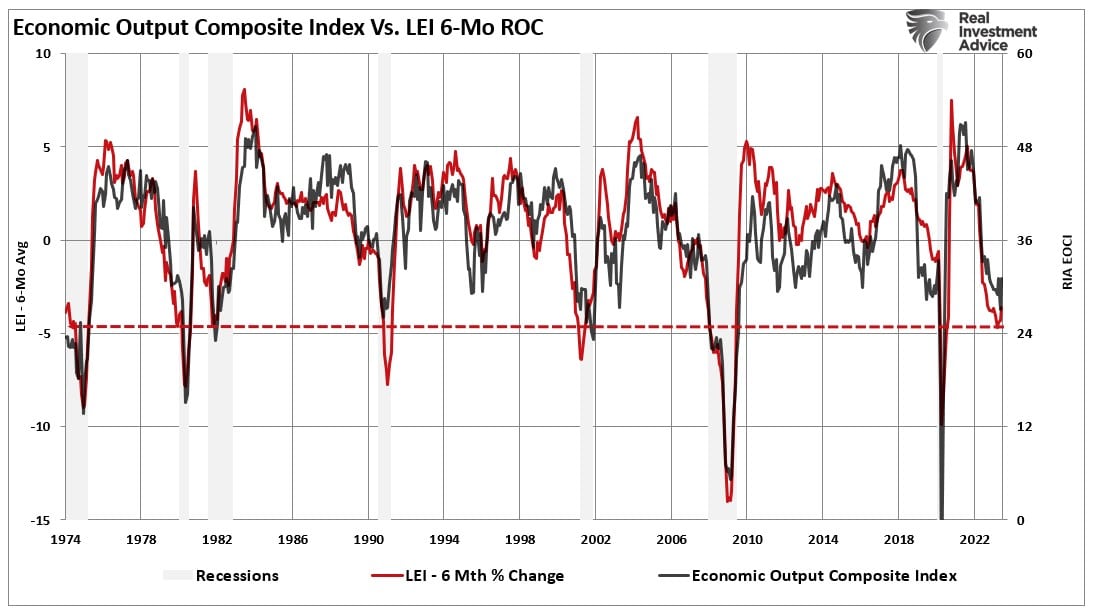
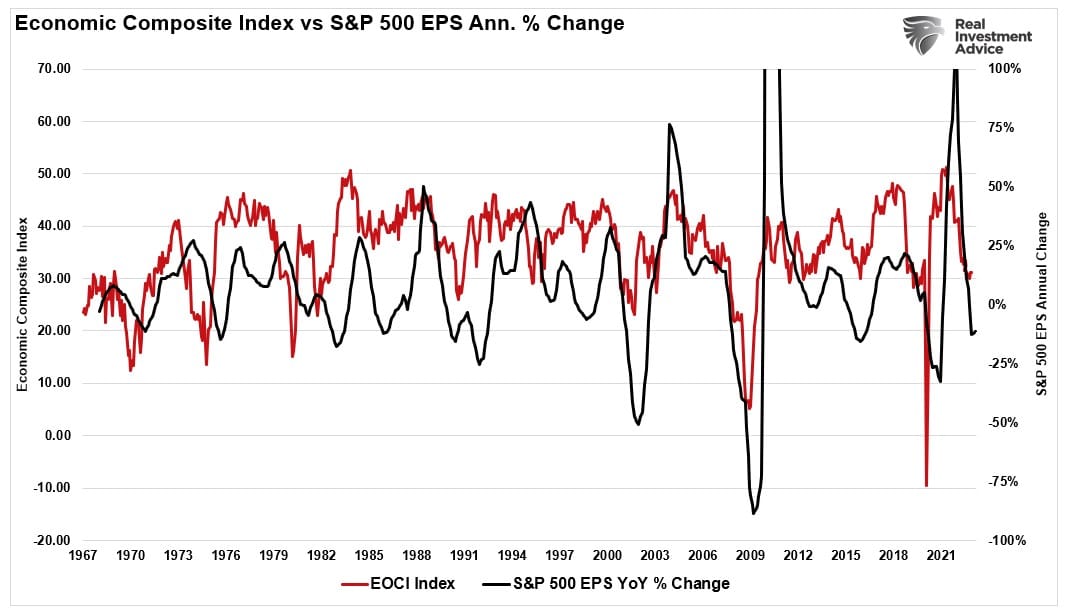
These economic measures are at levels that have marked the bottoms of economic contractions outside financial crises or economic shutdown events. Such suggests that we may see some improvement in economic activity in the coming months. If that is the case, we should also expect the earnings cycle to improve.
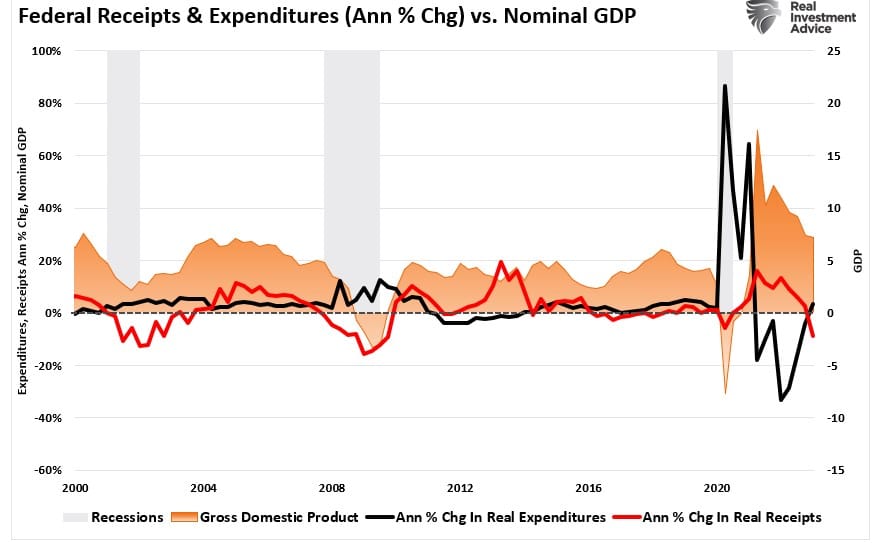
While there are reasons to remain suspect of an upturn in the current economic and market cycles, it is difficult to discount the historical evidence completely. Yes, the Federal Reserve has hiked rates aggressively, which weighs on economic activity by reducing personal consumption. However, the government continues to increase spending levels sharply, i.e., the Inflation Reduction Act, which supports economic growth.
While I suggest continued improvement in both the economic and market cycles, I remain skeptical of Ed Yardeni’s more optimistic view. As noted, the impact of higher interest rates, tighter bank lending standards, and falling inflation will likely undermine that optimistic view as estimates adjust to economic realities.
However, while the current economic and market cycles suggest a turn higher in the coming months, such does not preclude a correction.
A Correction Is Likely Along The Way
“Despite his positive outlook, Yardeni expresses concerns about a potential market correction in the near term. He worries that the significant rally seen this year may lead to an overheated market, which could result in a subsequent downturn. Yardeni emphasizes the importance of a stable and controlled bull market, as excessive gains often precede sharp declines.”
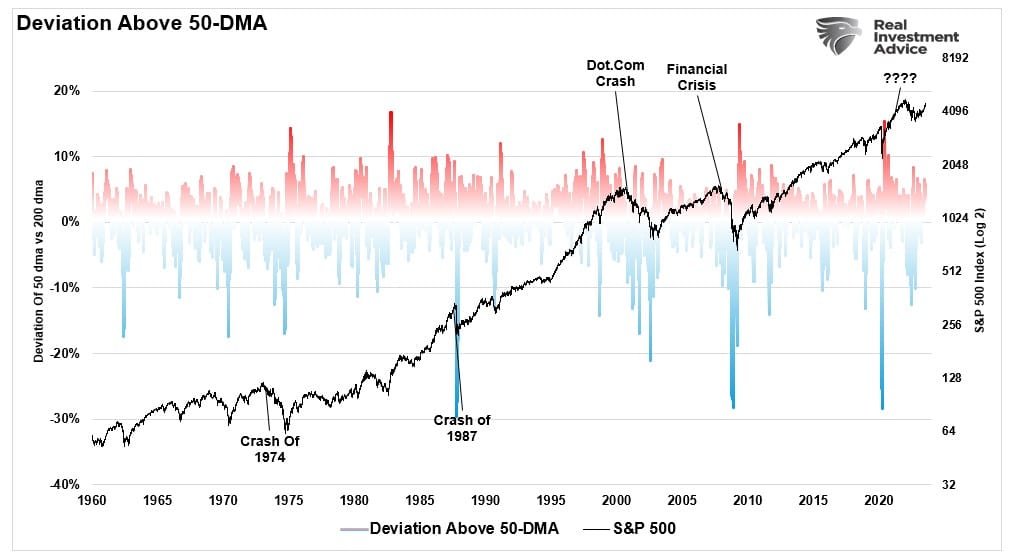
As we are now, investors believe the market can only go higher amid a bullish market cycle. However, 3-5% corrections in any given year are normal, even in bullish markets. Market deviations above the 50-day moving average tend to revert regularly.
Such is simply a function of short-term excesses due to speculative market activity reversing. As portfolio managers, this is why, during very short-term periods, we give more weight to technical versus fundamental analysis. One such analysis is our technical overbought/sold gauge which comprises several price indicators (RSI, Williams %R, etc.) and is measured using “weekly” closing price data. Readings above “80” are considered overbought, and below “20” is oversold.
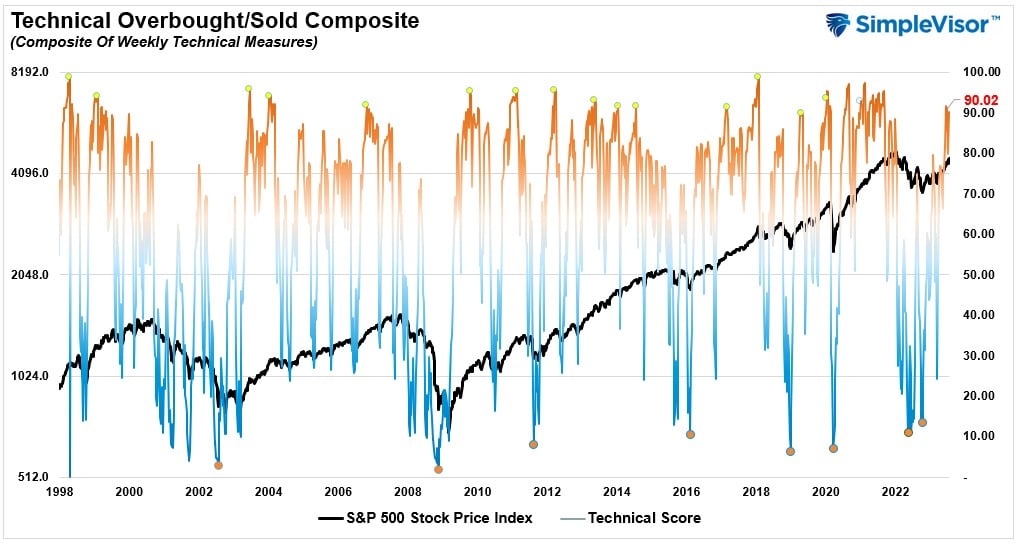
The current overbought condition of the market historically aligns with short-term market corrections. However, market risks become more evident when combining the technical with sentiment readings.
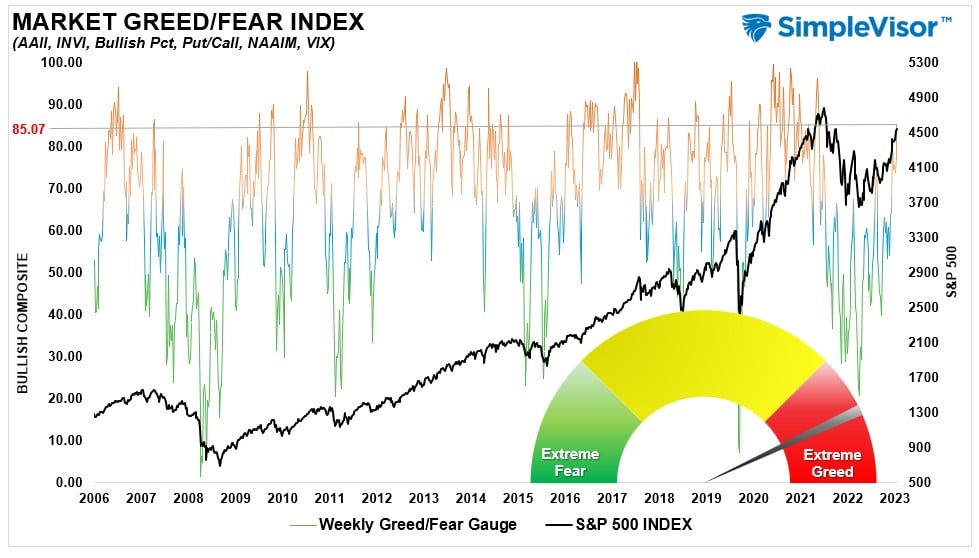
Greed Is Back
The “Fear/Greed” gauge is how individual and professional investors are “positioning” themselves in the market based on their equity exposure. From a contrarian position, the higher the allocation to equities, the more likely the market is closer to a correction. The gauge also uses weekly closing data.
With both technical and sentiment readings suggesting the short-term market risks are elevated, it is likely wise that investors use the current speculative frenzy to rebalance portfolio risks accordingly.
- Tighten up stop-loss levels to current support levels for each position.
- Hedge portfolios against major market declines.
- Take profits in positions that have been big winners.
- Sell laggards and losers.
- Raise cash and rebalance portfolios to target weightings.
While the current economic and market cycles will likely turn more bullish, the market has already “priced in” that improvement. Such leaves investors at risk of potential disappointment. Taking action to rebalance portfolio risks allows for taking advantage of corrections during improving market cycles.
If I’m wrong, and the subsequent correction is a resumption of the bear market, then reduced allocations ahead of time will hedge portfolios against that risk as well.
How We Are Trading It
From a portfolio management perspective, we have to trade the market we have rather than the one we think should be. This can make the challenge of battling emotions difficult from week to week. However, as noted, we expect a correction next month, providing a better risk/reward opportunity to increase equity exposure.
For now, the bullish trend continues but is getting very overbought. While we have increased our equity exposure over the last month, we remain underweight overall.
Continue taking action in portfolios accordingly, depending on your risk tolerance and goals. Just remember that no one ever went broke taking a profit.
Have a great weekend.
Research Report

Subscribe To “Before The Bell” For Daily Trading Updates (Formerly 3-Minutes)
We have set up a separate channel JUST for our short daily market updates. Please subscribe to THIS CHANNEL to receive daily notifications before the market opens.
Click Here And Then Click The SUBSCRIBE Button
Subscribe To Our Youtube Channel To Get Notified Of All Our Videos
Bull Bear Report Market Statistics & Screens

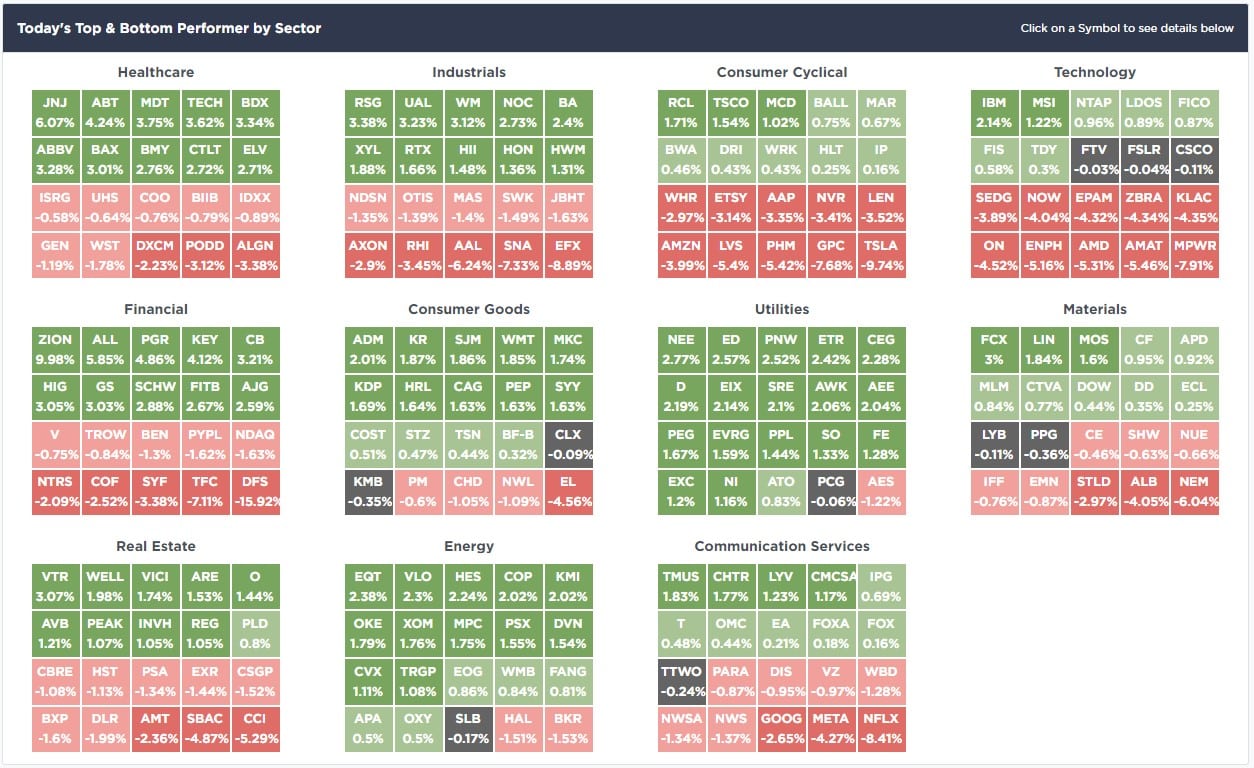
SimpleVisor Top & Bottom Performers By Sector
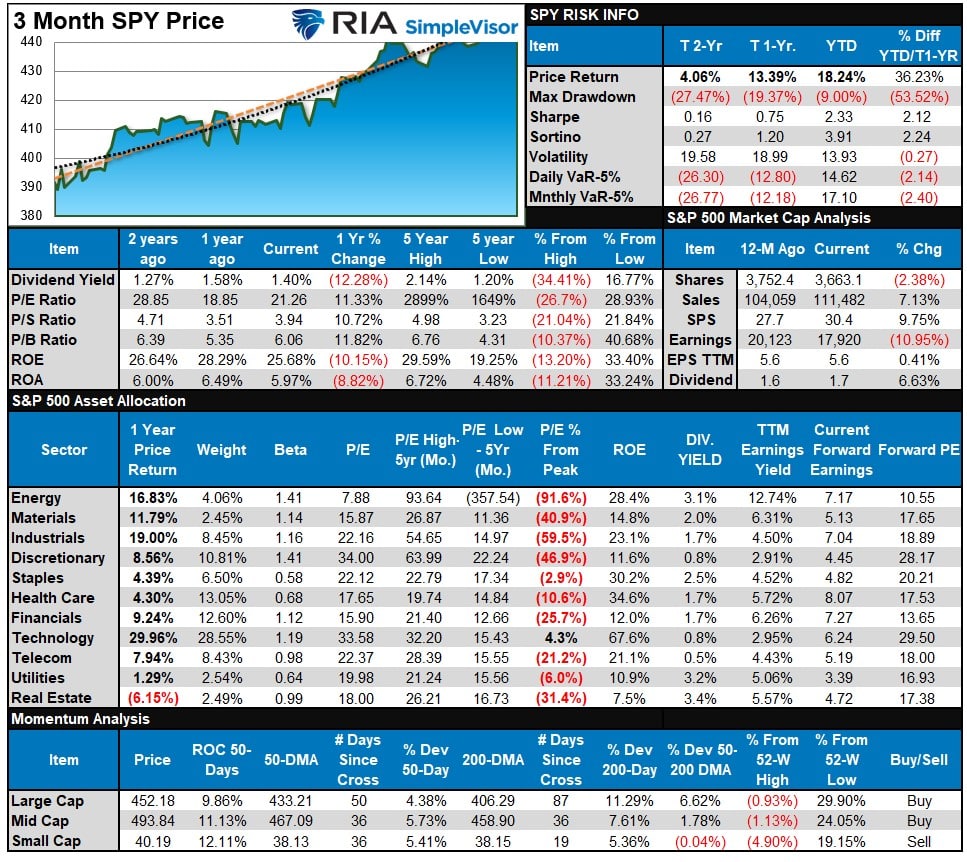
S&P 500 Weekly Tear Sheet
Relative Performance Analysis
Last week we noted the market bounced rather strongly amid high levels of complacency, taking the market to a new 52-week high. As we said:
“That bounce pushed much of the broad market complex back into extreme short-term overbought conditions. Such suggests more consolidation is needed, but any dips to support levels should be bought.”
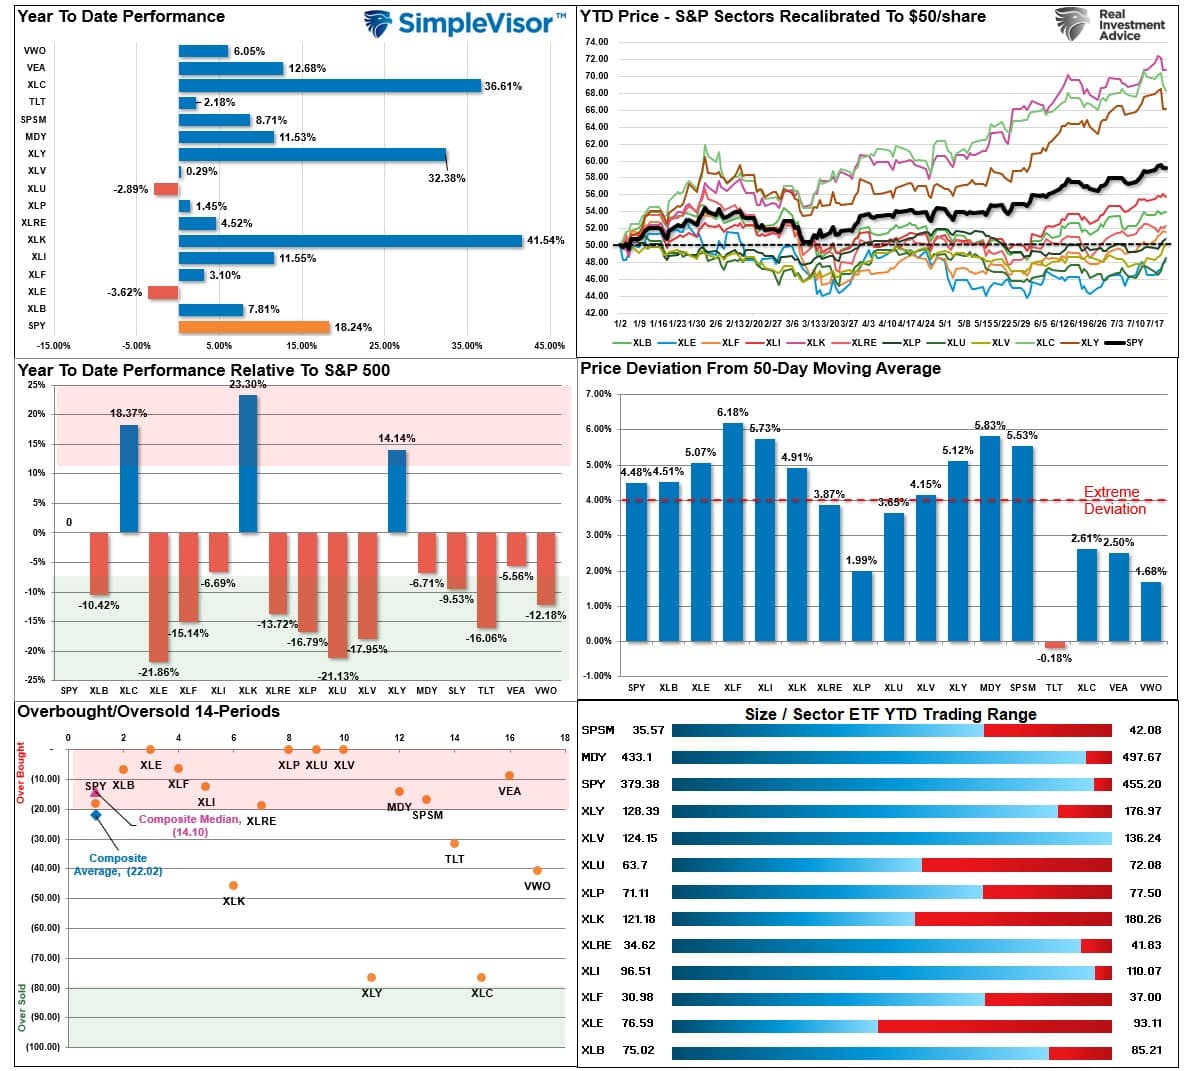
That remains the case this week. The YTD price changes show that the leading sectors lagged this past week while the laggards gained traction. This is the rotation that we discussed previously. Notably, that rotation will also prevent the broader market from declining dramatically. That is why we expect market corrections to be shallow to provide buying opportunities.
Technical Composite
The technical overbought/sold gauge comprises several price indicators (R.S.I., Williams %R, etc.), measured using “weekly” closing price data. Readings above “80” are considered overbought, and below “20” are oversold. The market peaks when those readings are 80 or above, suggesting prudent profit-taking and risk management. The best buying opportunities exist when those readings are 20 or below.
The current reading is 90.10 out of a possible 100.
Portfolio Positioning “Fear / Greed” Gauge
The “Fear/Greed” gauge is how individual and professional investors are “positioning” themselves in the market based on their equity exposure. From a contrarian position, the higher the allocation to equities, the more likely the market is closer to a correction than not. The gauge uses weekly closing data.
NOTE: The Fear/Greed Index measures risk from 0 to 100. It is a rarity that it reaches levels above 90. The current reading is 77.59 out of a possible 100.
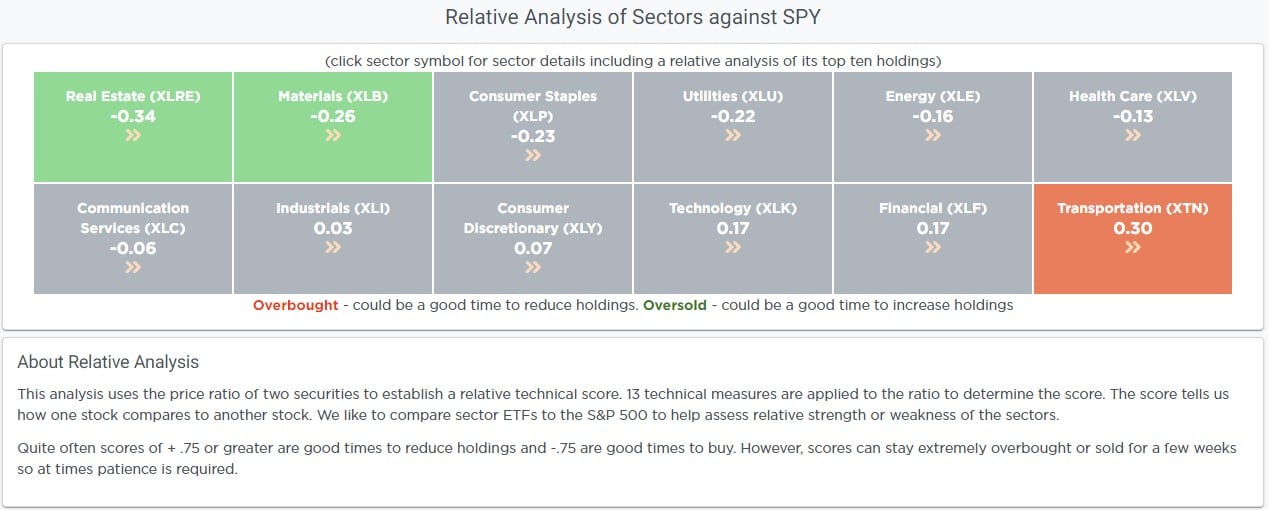
Relative Sector Analysis
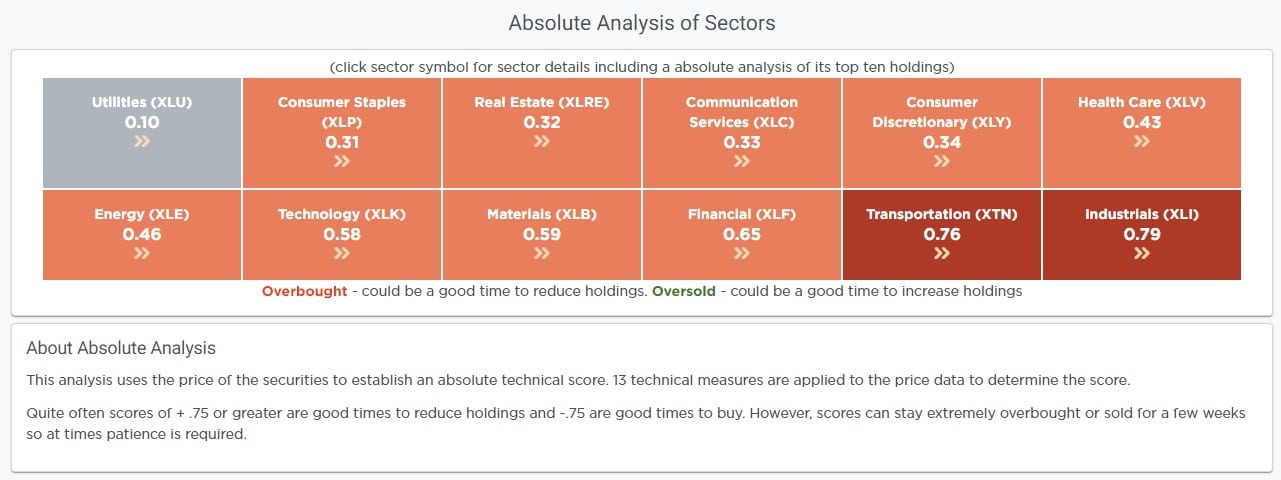
Absolute Sector Analysis
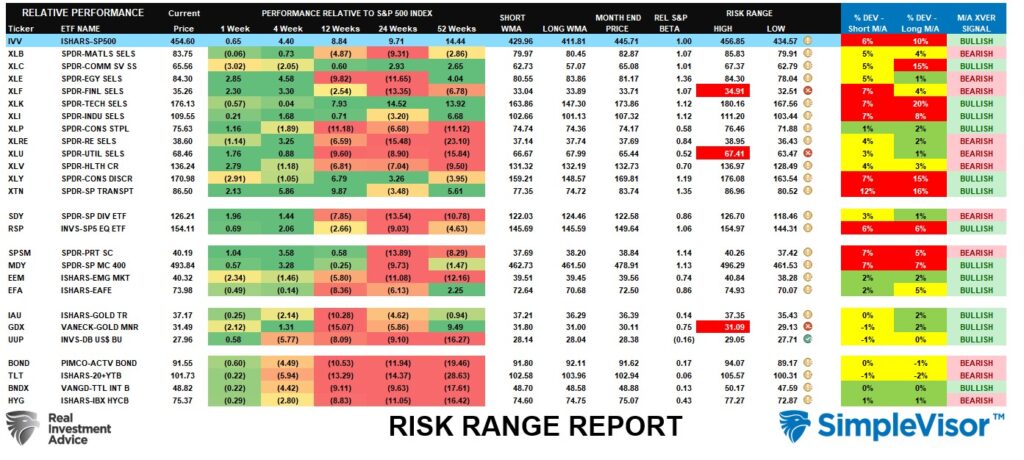
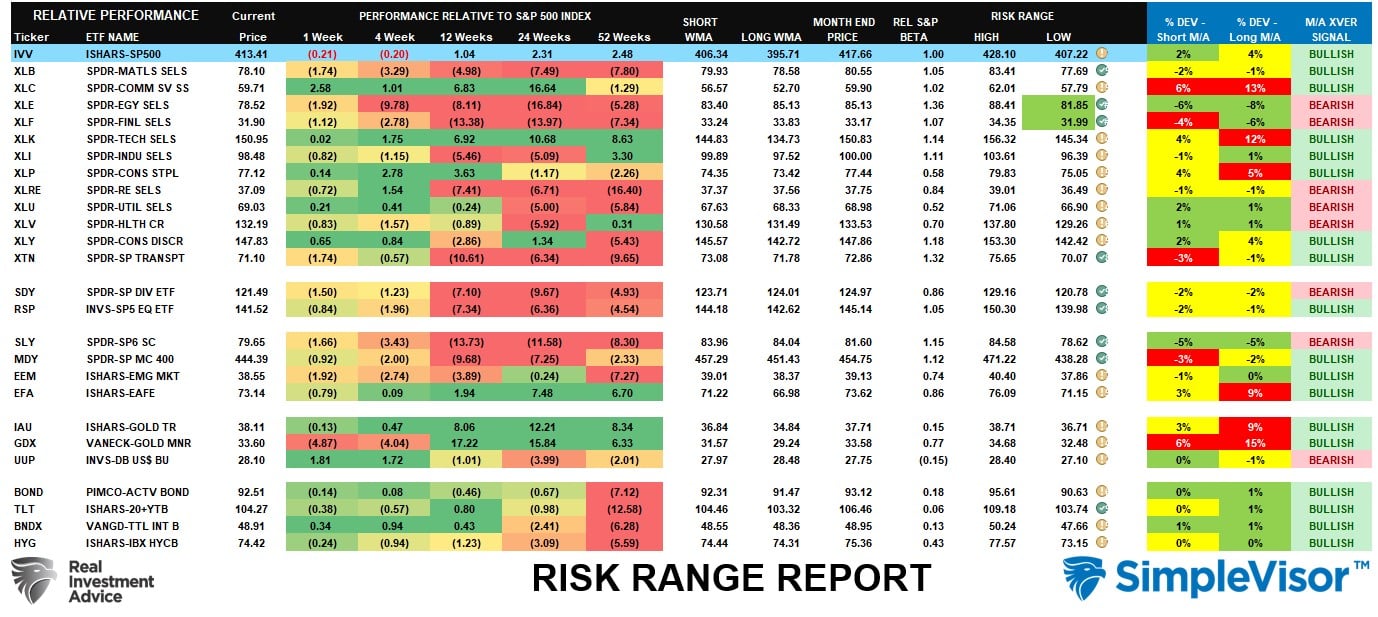
Sector Model Analysis & Risk Ranges
How To Read This Table
- The table compares the relative performance of each sector and market to the S&P 500 index.
- “MA XVER” (Moving Average Cross Over) is determined by the short-term weekly moving average crossing positively or negatively with the long-term weekly moving average.
- The risk range is a function of the month-end closing price and the “beta” of the sector or market. (Ranges reset on the 1st of each month)
- The table shows the price deviation above and below the weekly moving averages.
We recently discussed the market was ripe for a rotation from the leading markets and sectors to the lagging. We saw the beginning of that over the last few weeks as Financials and Real Estate saw a strong pickup in performance that has taken them outside their normal monthly performance ranges. Overall, the market remains decently overbought, with several sectors and markets still on weekly sell signals. We expect a 3-5% correction in the market short term, which should reduce some of this excess, providing a better entry point.
Weekly SimpleVisor Stock Screens
We provide three stock screens each week from SimpleVisor.
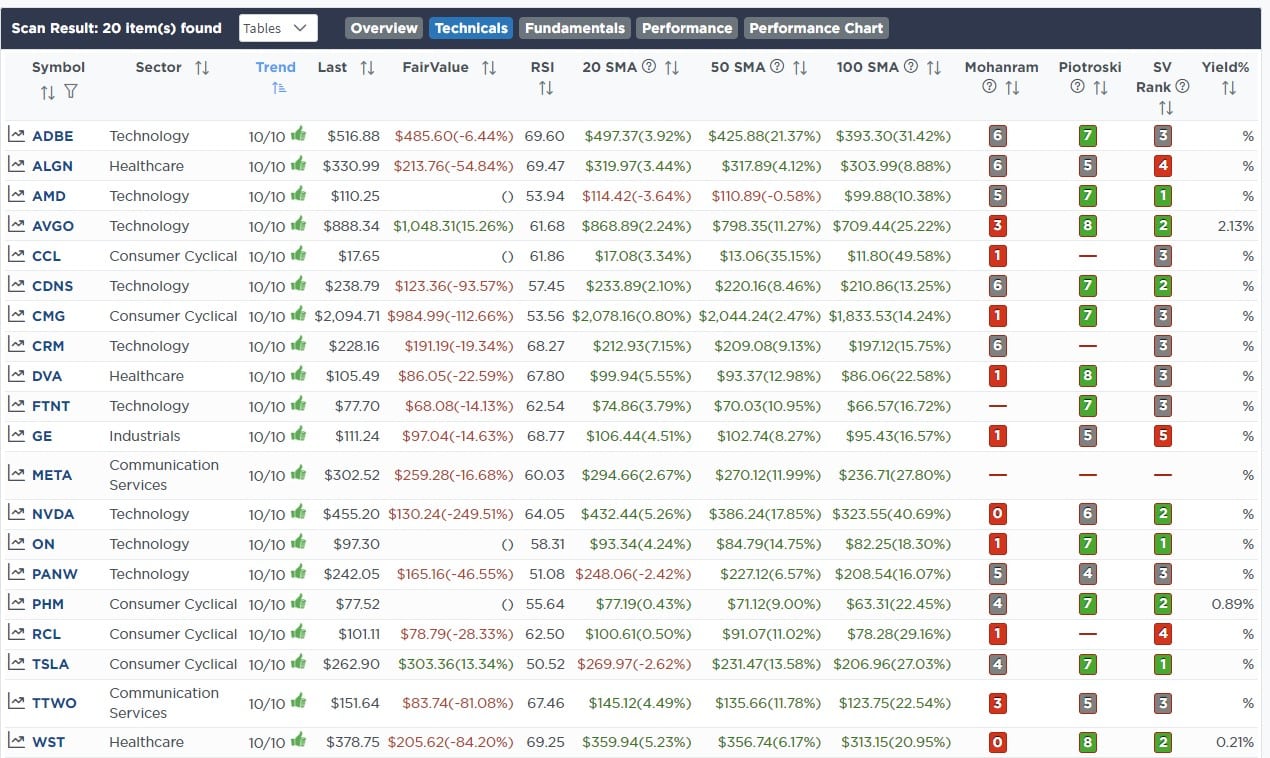
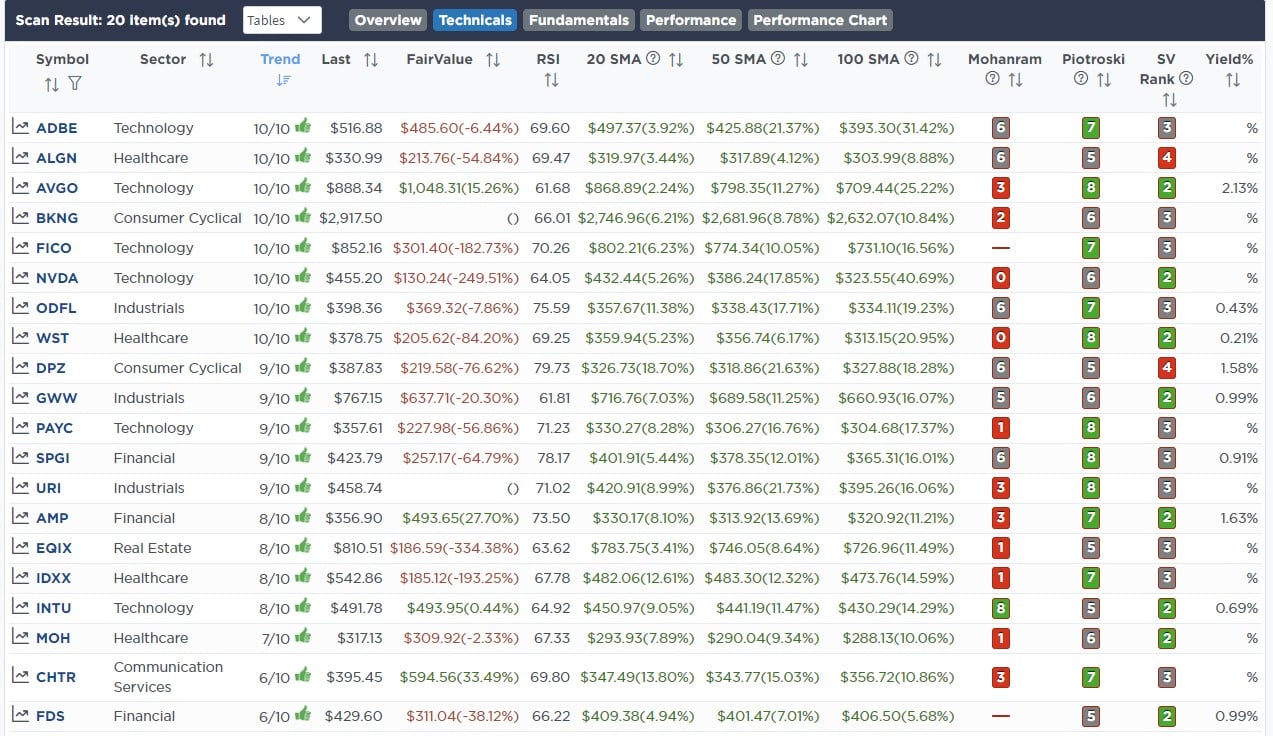
This week we are searching for the Top 20:
- Relative Strength Stocks
- Momentum Stocks
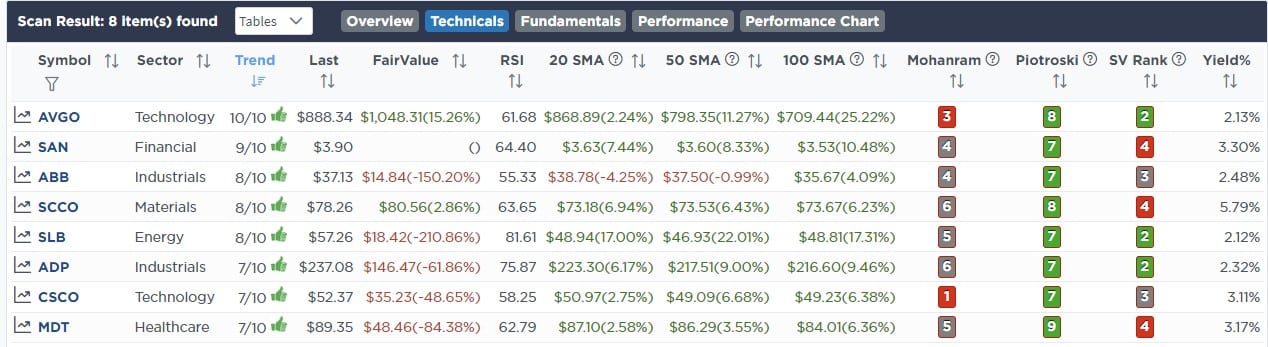
- Technically Strong Stocks With Dividends
(Click Images To Enlarge)
R.S.I. Screen
Momentum Screen
Technically Strong With Dividends
SimpleVisor Portfolio Changes
We post all of our portfolio changes as they occur at SimpleVisor:
July 20th
“This morning, we added one-half percent of the portfolio to Truist Financial (TFC) and PNC Bank (PNC) in the equity model and initiated a 2% of the portfolio position to the SPDR S&P Bank Index ETF (KBE) to the sector model.
As shown below, many regionals are breaking out of bullish inverse head and shoulders patterns. Further, we were waiting on earnings to get more comfortable with PNC and TFC before adding. In both cases, as is the case with most regionals, earnings were OK. Margins are shrinking, and loss reserves are rising, but deposits are only falling slightly. They have weathered the storm and remain very cheap versus the market and larger banks. It also helps that TFC has a dividend yield of over 6%, and PNC is over 4%.“
Equity Model
- Add 0.5% of the portfolio to Truist Financial (TFC)
- Increase PNC Bank (PNC) by 0.5% of the portfolio.
ETF Model
- Initiate a 2% of the portfolio position in the SPDR S&P Bank Index (KRB)

Lance Roberts, C.I.O.
Have a great week!


